

Patent Data Analysis
Patent Data Analysis
Weekly updates on the innovation economy.

Introduction
Today’s Drawing Capital newsletter focuses on visualizing the geographic sources of patents and analyzing patent data to inform perspectives about technological advancement.
Visualizing the Geographic Sources of Patents
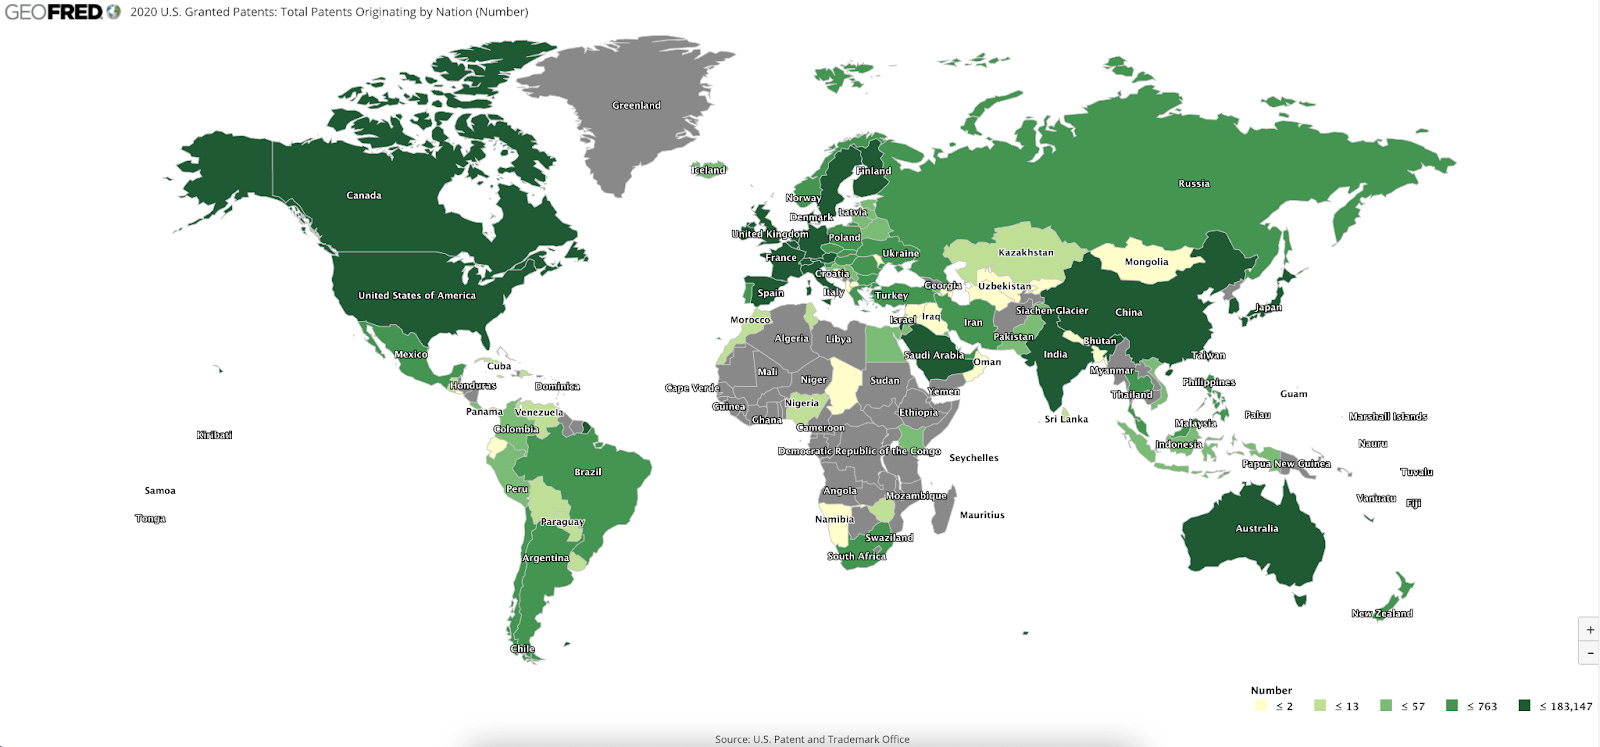
The following countries originate a significant number of American patents: America, Canada, Australia, India, China, Saudi Arabia, Iceland, and western European countries:
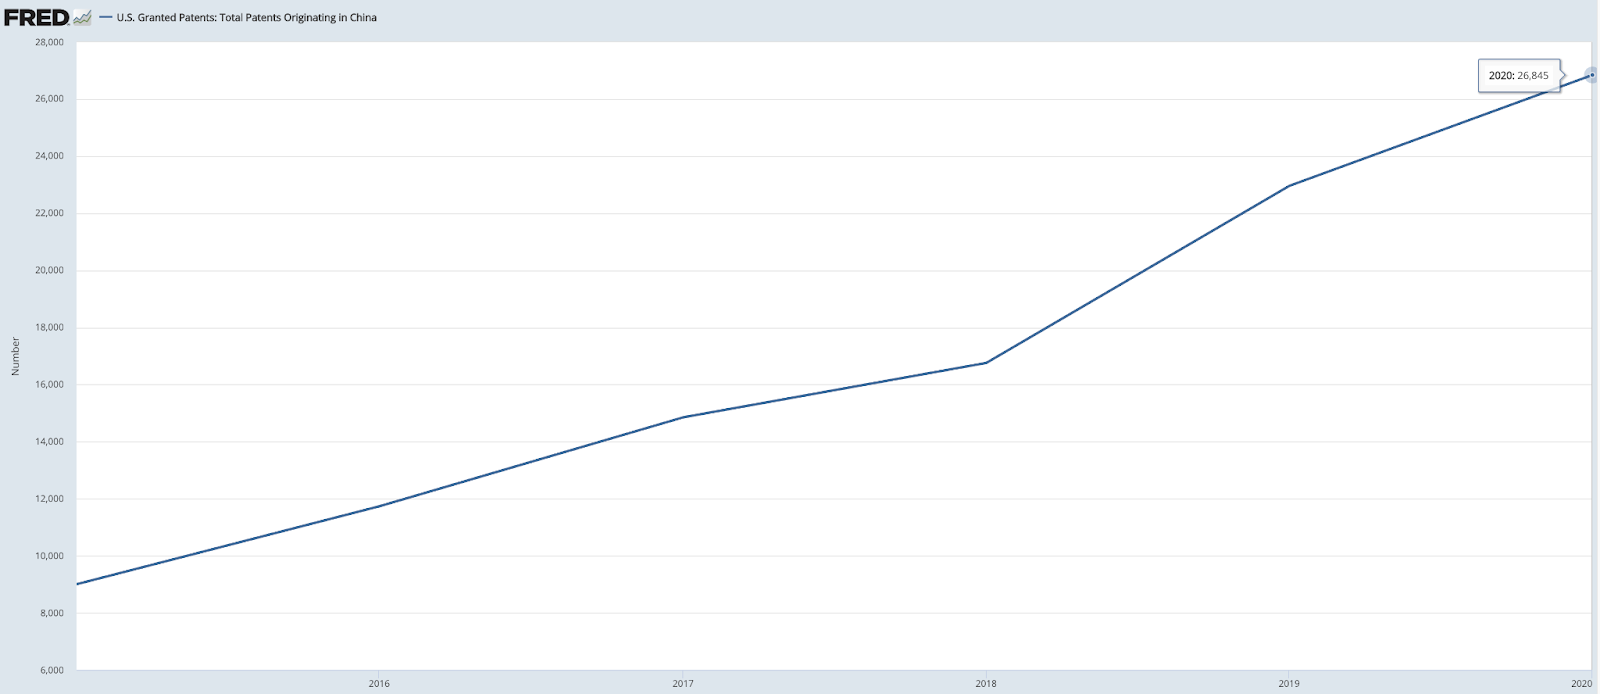
Interestingly, the number of American granted patents that originate in China have nearly tripled from 2015 to 2020:
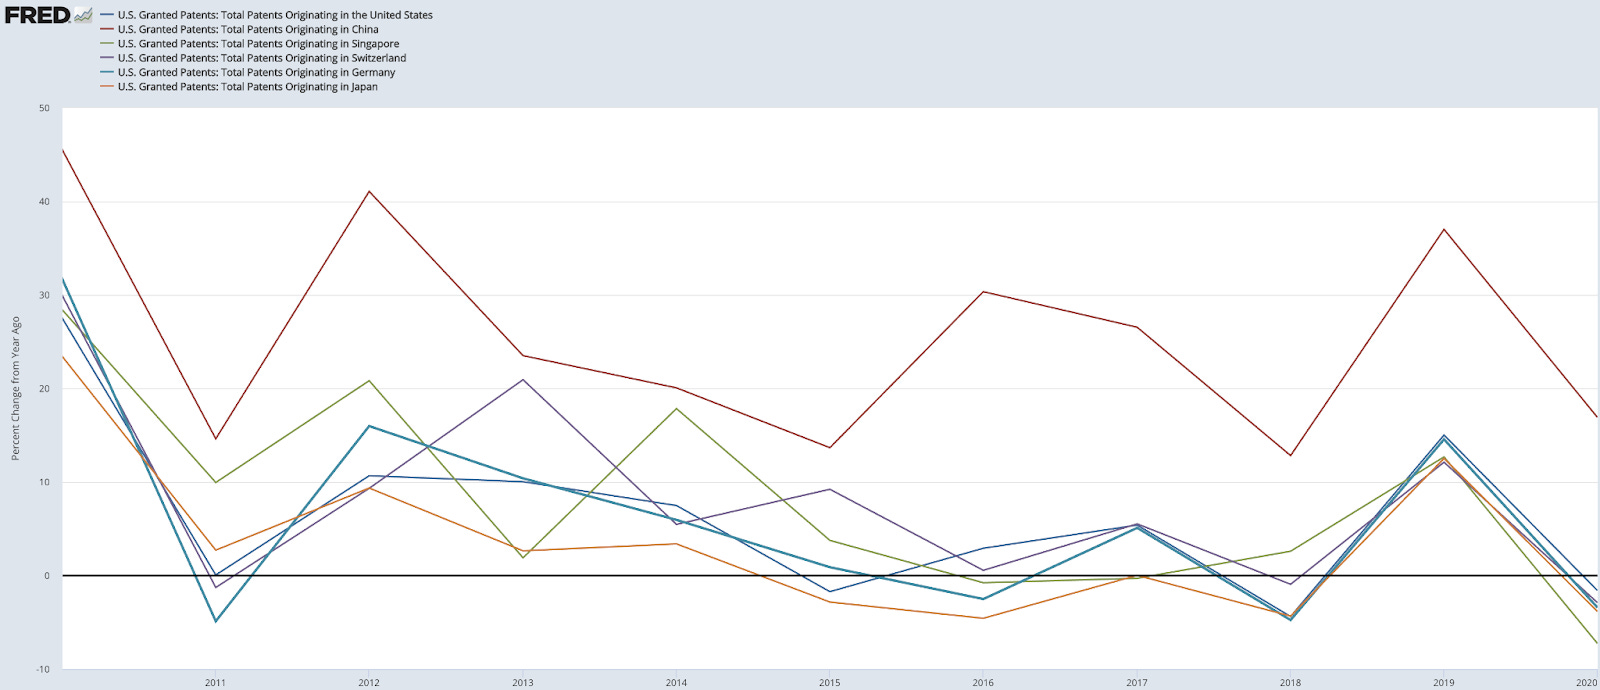
In a comparison of America vs. China vs. Singapore vs. Switzerland vs. Germany vs. Japan, the winner for the award for the highest growth rate in US granted patents goes to China. Nonetheless, there has been a deceleration in growth rates in granted patents in America over the decade, as seen by the following chart:
Patent Data Analysis and Associations with Technological Advancement
An academic research paper titled “Technological Improvement Rate Predictions for All Technologies: Using Patent Data and an Extended Domain Description” was published online in July 2021. This academic research paper is co-authored by Anuraag Singh, Giorgio Triulzi, and Christopher Magee, and the source link to this published work can be found at this website link: https://www.sciencedirect.com/science/article/pii/S0048733321000950
The following highlights from this academic research paper provide a nice summary of patent data analysis.
Across 1757 technology domain categories, the co-authors devised a method for forecasting rates of yearly performance improvements via analyzing patents in the US patent system:
These 1757 technology domain categories represent over 97% of all patents in the entire US patent system.
Over 86% of the technology domain categories have less than 100 patents each, indicating that most domain categories are smaller in nature.
About 90% of patents are filed in technology domain categories that have at least 1000 patents, indicating that most patents target large or well-known total addressable markets.
Total factor productivity is an economic term that is an aggregate measure for the rate of technological change.
“Performance improvements for individual technologies follow exponential trends over time. This implies that technologies experience constant yearly rates of improvement, albeit having very different rates.”
“The rate of improvement of performance for a technology is an important indicator of the potential future importance of that technology” … “Faster improving technologies have faster product life cycles”.
When multiple technologies combine, converge, or interact with each other, this spillover & overlapping effect can enable more productivity benefits across various industries and the general economy.
Wright’s Law is a forecasting method to observe the relationship between a cost decline curve of a technology and cumulative production. Wright’s Law is also known as a “performance improvement, experience, and learning curve” because per-unit production costs can decrease with additional technological improvement and higher production quantity. Wright’s Law is defined by the following power law formula:
Cumulative average production cost per unit = cost to produce first unit * (cumulative production quantity)^(slope)
Moore’s Law is one of the most famous examples of exponential technological improvement in the long term. Interestingly and according to the co-authors, “Moore’s Law holds even when the number of patents do not increase exponentially with time. This suggests that Moore’s Law is fundamental over the long-term and independent of “effort” variables such as total number of patents”.
After analyzing patent data, the co-authors concluded that “the use of software and algorithms provide the opportunity for a higher realized growth rate of progress compared to previously forecasted models. The fastest growth rates in technological improvement are often related to software development and software-enabled technologies across industries”.
After analyzing patent data, the co-authors found that “software domains are generally improving more rapidly than other types of domains… technologies related to the internet in general and enterprise network management in particular are predicted to be the fastest improving technologies”
“More than 83% of the technology domain are improving at a rate of less than 25% per annum and more than two-thirds of the domains are improving at a rate less than 15% per annum.... Only 188 of the 1757 domains are improving at more than 36.5% per year… Performance for the average technology improves at a rate of 19% per annum with a standard deviation of 26% per annum”. This quote has a number of fascinating insights, including:
High-growth technology domain categories with 25%+ growth rates in technological progress are in a concentrated minority, and most technology domain categories have historically experienced just mild to moderate growth rates. At Drawing Capital, we have a strong focus on high-growth cloud software companies.
Several of the fastest growing technology domain categories for patents in the US patent system include dynamic information exchange, network technology, cybersecurity & access management, content delivery networks for distributing video, data encryption, methods of mixing encrypted digital data with unencrypted digital data, data management, novel data structures & applications, business process automation, delivery of software & content over internet, and automation of e-commerce activities.
There is a necessity to build, innovate, and advance society forward in order to reduce technological and economic stagnation and improve societal outcomes.
The rates of progress across technological improvement are not equally distributed within categories, and the distribution curve is very skewed. As a result, the key takeaway from the research paper is that the recent state of technological improvement in aggregate has been incremental, not innovative, in the majority of technologies, which contributes to economic stagnation in America while simultaneously creating significant prosperity to those embracing high-growth technological achievement.

References:
U.S. Patent and Trademark Office. “U.S. Granted Patents: Total Patents Originating in China.” FRED, Federal Reserve Bank of St. Louis, fred.stlouisfed.org/series/PATENT4NCNTOTAL. Accessed 26 Oct. 2021.
Singh, Anuraag, et al. “Technological Improvement Rate Predictions for All Technologies: Use of Patent Data and an Extended Domain Description.” Elsevier Research Policy, vol. 50, no. 9, 12 June 2021, p. 104294, www.sciencedirect.com/science/article/pii/S0048733321000950. Accessed 17 Oct. 2021.
This letter is not an offer to sell securities of any investment fund or a solicitation of offers to buy any such securities. An investment in any strategy, including the strategy described herein, involves a high degree of risk. Past performance of these strategies is not necessarily indicative of future results. There is the possibility of loss and all investment involves risk including the loss of principal.
Any projections, forecasts and estimates contained in this document are necessarily speculative in nature and are based upon certain assumptions. In addition, matters they describe are subject to known (and unknown) risks, uncertainties and other unpredictable factors, many of which are beyond Drawing Capital’s control. No representations or warranties are made as to the accuracy of such forward-looking statements. It can be expected that some or all of such forward-looking assumptions will not materialize or will vary significantly from actual results. Drawing Capital has no obligation to update, modify or amend this letter or to otherwise notify a reader thereof in the event that any matter stated herein, or any opinion, projection, forecast or estimate set forth herein, changes or subsequently becomes inaccurate.
This letter may not be reproduced in whole or in part without the express consent of Drawing Capital Group, LLC (“Drawing Capital”). The information in this letter was prepared by Drawing Capital and is believed by the Drawing Capital to be reliable and has been obtained from sources believed to be reliable. Drawing Capital makes no representation as to the accuracy or completeness of such information. Opinions, estimates and projections in this letter constitute the current judgment of Drawing Capital and are subject to change without notice.