


Happy New Year! We wish you a warm, healthy, and prosperous new year ahead. Today’s Drawing Capital blog post summarizes 10 themes in the 2021 year:
Coronavirus Cases & Vaccination Data in America
Airline Travel
Rising Inflation
Jobs & Employment Trends
Monetary Policy, Money Supply, Federal Debt
Category-Specific Bubbles & Bursts in 2021
Big Technology Companies
Innovation Themes
Divergence in Volatility
Crypto Goes Mainstream
Coronavirus Cases


American coronavirus cases rapidly declined in mid-2021 after widespread distribution of the coronavirus vaccine, although breakthrough cases (particularly due to the Omicron variant) and cases among the unvaccinated population continue to occur, leading to skyrocketing new cases recently.

Airline Travel
Despite a pandemic-impacted world and various coronavirus variants, many Americans have returned back towards their normalized airline travel levels. Airline travel rebounded significantly since March 2021 and is more than 80% of the way there in reaching back to 2019 pre-coronavirus levels for airline travel, as measured by the number of airline travelers that are measured by the TSA.


Rising inflation
The following illustration highlights popular causes of inflation:
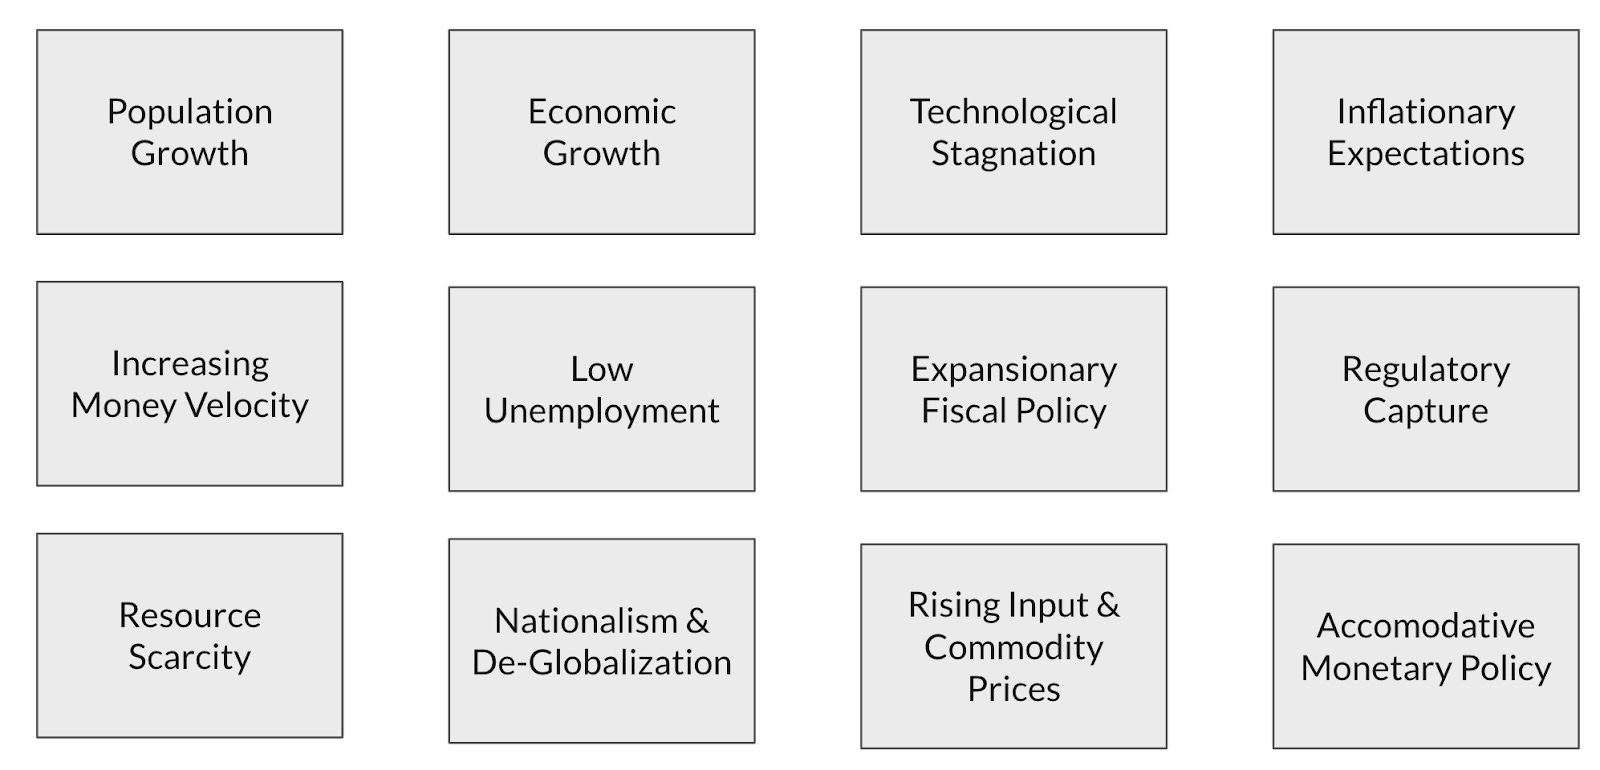
Notably, there are several forms of inflation, and inflation can be directly and indirectly seen through a variety of channels:

The following chart highlights the significant inflation rates that have been experienced by consumers across a broad range of categories from November 2020 to November 2021. While the consumer price index (blue bar) experienced a 6.8% inflation rate, it’s clear that many individuals experienced a much higher inflation rate for several everyday products and food items, as displayed by the chart below.

Inflation represents a decrease in purchasing power, which implies that more US Dollars are needed to purchase the same amount of goods or services. While the Federal Reserve maintains a 2% inflation target, the reality for the lives of millions of Americans is that their personal inflation rate far exceeds 2% per year, as seen by rising costs in healthcare, college tuition, rent and housing affordability. At a 5% inflation rate, a surprising 40% of one’s purchasing power evaporates over 10 years.

When interest rates earned on cash balances are less than inflation rates, holding high cash balances for extended periods of time reduces its purchasing power. Despite this knowledge, trillions of dollars remain in money market accounts that earn negative inflation-adjusted returns.
Jobs & Employment Trends


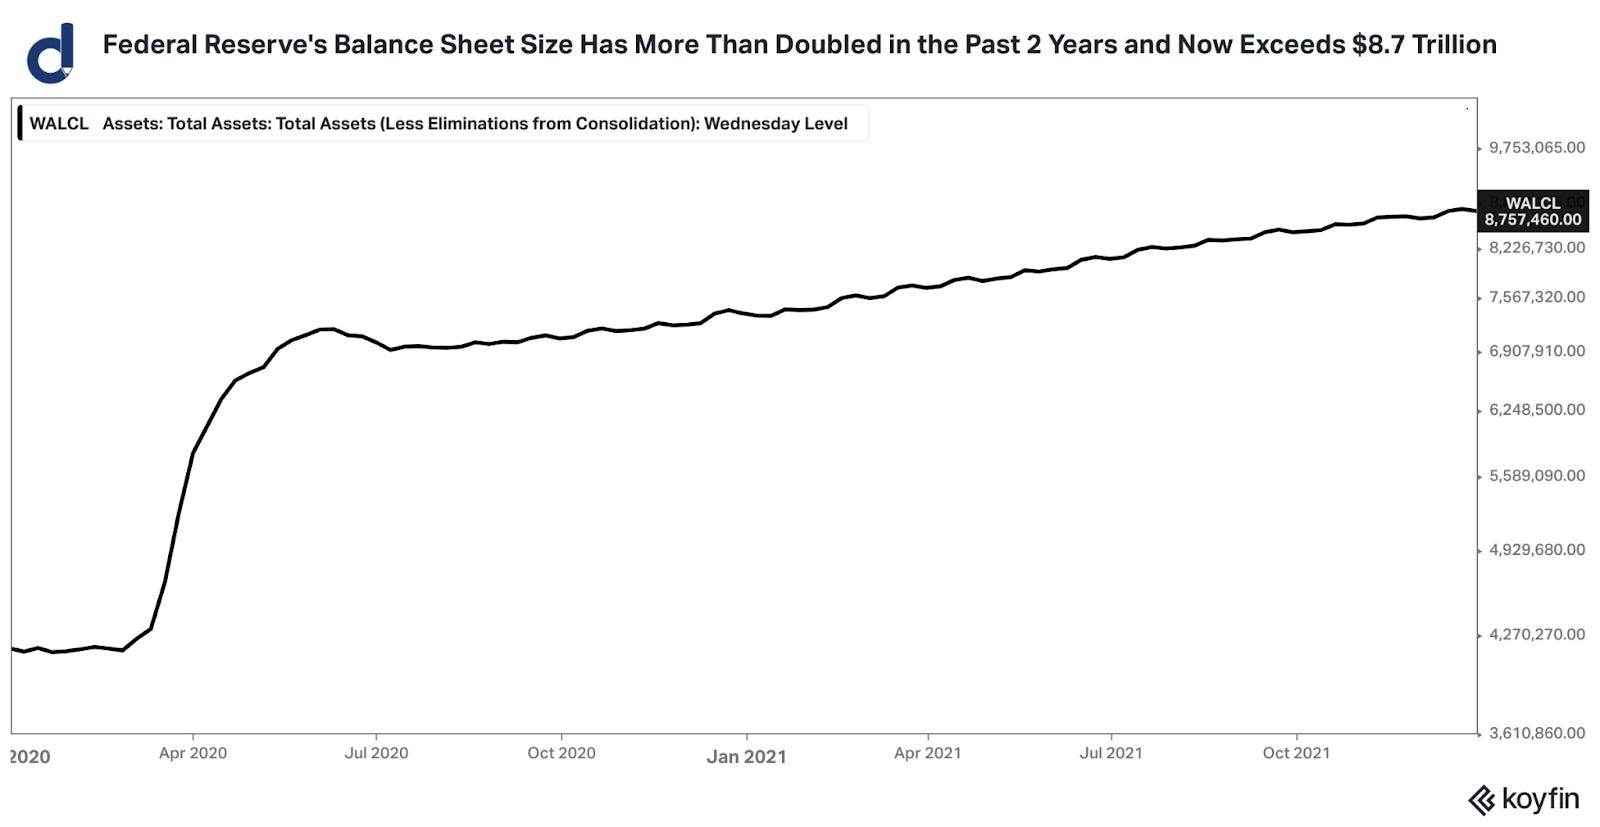
Monetary Policy, Money Supply, and Federal Debt
Despite discussions about tapering and upcoming interest rate increases, the Federal Reserve’s monetary policy continues to be somewhat stimulative and expansionary with balance sheet expansion at this time.

Amid significant spending and expenditures under the 1st year of the Biden Administration, the American government’s fiscal deficit and total debt soared to record levels.


Category-Specific Asset Bubbles and Bursts in 2021.
In 2021, the distribution of vaccines & Chinese regulation & hints at reducing the magnitude of expansionary monetary policy in America contributed to the “bursting” of inflated asset prices in the following categories: SMID-cap biotech, several e-commerce stocks, several recently-IPO’d companies, Chinese Big Tech equities, work-from-home stocks, speculative “fast money” stocks, and several SPACs.


Big Technology Companies
Big technology companies continue to march forward and create tremendous consumer value and market cap creation.
The cumulative market valuations of Facebook (Meta), Amazon, Netflix, Google (Alphabet), Microsoft, Apple, and NVIDIA (collectively known as “FANGMAN” companies) exceeded the $10 trillion milestone in July 2021 and approached nearly $11 trillion at the end of 2021. Importantly, all 7 of these companies share the following trait of being platform technology companies. Among the FANGMAN companies, NVIDIA’s stock experienced the highest percentage price appreciation in 2021.


For many investors, the dual idea of high returns on invested capital with minimal probability of long-term capital impairment (permanent loss) is very attractive.
Between the end of December 2011 to the end of December 2021, the QQQ ETF increased in price from about $56/share to about $398/share, which equates to about a 7x price increase.
Since 2009, the NASDAQ 100 ETF under ticker symbol “QQQ” has almost always appreciated in value in each calendar year (with the exception of 2018, which was a very minor loss of less than 1%).
For a more extreme and levered version of the NASDAQ 100 Index, TQQQ is a leveraged fund that uses derivatives to seek a 3x daily return of the NASDAQ 100 Index. Of course, the use of leveraged funds carries additional risks for investors, historical performance is not necessarily predicative nor indicative of future results, and additional disclosures and knowledge are warranted for leveraged funds. Looking at the chart below from Morningstar, a $10,000 investment made near the end of calendar year 2011 in TQQQ would have grown to about $1.2 million.


Innovation Themes
While 2020 presented tremendous opportunities from investing in the “innovation economy”, ETFs that tracked these themes in 2021 often experienced varying and lower degrees of performance compared to the 2020 calendar year.

Additionally, the following chart below illustrates a comparison between ARK’s flagship innovation fund (ticker: ARKK) and Vanguard’s S&P 500 index fund (ticker: VOO). In 2021, ARK Invest’s negative performance divergence between ARKK and VOO was the largest in history for a calendar year since ARKK’s fund inception date.

In addition, the following visualization illustrates various index fund performances across various categories and compares 2020 vs. 2021 returns. Notably:
Despite the coronavirus crisis and the resulting economic and health consequences, all 4 popular US market indices (NASDAQ 100, S&P 500, Dow Jones Industrial Average, Russell 2000) had positive returns in both 2020 and 2021. In particular, the following 5 fund ticker symbols had 20%+ returns in both 2020 and 2021, demonstrating durability in returns in both the coronavirus crisis period and the coronavirus recovery period: QQQ, SPYG, XLK, XLY, and XLB.
Across the main equity sectors, the energy sector had the biggest performance divergence between 2020 and 2021, as evidenced by the XLE fund as a proxy for tracking the performance of a basket of energy stocks. Between 2020 to 2021, XLE went from “worst to first” in terms of American equity sector returns.

Divergence in Volatility
While the VIX index (a measure of volatility for the US stock market) fell considerably in 2021, the MOVE index (a measure of volatility for the US bond market) rose significantly in 2021, marking a divergence in volatility between the stock market and bond market. Additionally, the US stock market performed significantly better than the US bond market in 2021.


Crypto Goes Mainstream
As of 9/30/2021, Coinbase had more than 73 million verified users, $327 billion in quarterly volume traded, and $255 billion in assets on the Coinbase platform.
According to Dune Analytics, the number of OpenSea users surged from about 36,000 at the beginning of 2021 to over 900,000 on 12/31/2021. According to Decrypt, OpenSea’s trading volume exceeded $10 billion in 2021, marking a substantial increase from the prior year. OpenSea is a leading NFT marketplace platform.

This comparison chart about internet adoption versus crypto adoption from Coinbase’s Q3 2021 shareholder letter was particularly thought-provoking:

As illustrated from this price graph from Coinbase, Solana experienced a surge in value in 2021.

Over the past year, there has been significant and rising individual and institutional interest in Bitcoin, Ethereum, Solana, web3, blockchain technologies, crypto-focused venture capital funding, NFTs, digital assets, and more in the crypto-economy.

References:
Bureau of Labor Statistics, https://www.bls.gov/news.release/pdf/cpi.pdf
Coronavirus Deaths Data from the CDC, https://covid.cdc.gov/covid-data-tracker/#trends_dailydeaths
Coronavirus Vaccination Data from the CDC, https://covid.cdc.gov/covid-data-tracker/#vaccination-trends
Coronavirus Daily Cases Data from the CDC, https://covid.cdc.gov/covid-data-tracker/#trends_dailycases
Morningstar, https://www.morningstar.com/
TQQQ Performance Data from Morningstar, https://www.morningstar.com/etfs/xnas/tqqq/performance
TSA Passenger Data, https://www.tsa.gov/coronavirus/passenger-throughput
Coronavirus Data from Bloomberg, https://www.bloomberg.com/graphics/2020-united-states-coronavirus-outbreak/
Coinbase Company Highlights, https://investor.coinbase.com/home/default.aspx
Solana Price from Coinbase, https://www.coinbase.com/price/solana
Dune Analytics for OpenSea Users, https://dune.xyz/queries/2877/5680
Decrypt for OpenSea’s Volume, https://decrypt.co/85507/nft-marketplace-opensea-hits-10b-total-volume
Coinbase’s Q3 2021 Shareholder Letter, https://www.sec.gov/Archives/edgar/data/0001679788/000167978821000069/secq3202111_81020ampst.htm
MOVE Index / VIX Index Ratio from Bloomberg, https://www.bloomberg.com/opinion/articles/2021-12-31/hindsight-capital-made-the-best-trades-in-2021-with-a-little-bold-contrarianism
This letter is not an offer to sell securities of any investment fund or a solicitation of offers to buy any such securities. An investment in any strategy, including the strategy described herein, involves a high degree of risk. Past performance of these strategies is not necessarily indicative of future results. There is the possibility of loss and all investment involves risk including the loss of principal.
Any projections, forecasts and estimates contained in this document are necessarily speculative in nature and are based upon certain assumptions. In addition, matters they describe are subject to known (and unknown) risks, uncertainties and other unpredictable factors, many of which are beyond Drawing Capital’s control. No representations or warranties are made as to the accuracy of such forward-looking statements. It can be expected that some or all of such forward-looking assumptions will not materialize or will vary significantly from actual results. Drawing Capital has no obligation to update, modify or amend this letter or to otherwise notify a reader thereof in the event that any matter stated herein, or any opinion, projection, forecast or estimate set forth herein, changes or subsequently becomes inaccurate.
This letter may not be reproduced in whole or in part without the express consent of Drawing Capital Group, LLC (“Drawing Capital”). The information in this letter was prepared by Drawing Capital and is believed by the Drawing Capital to be reliable and has been obtained from sources believed to be reliable. Drawing Capital makes no representation as to the accuracy or completeness of such information. Opinions, estimates and projections in this letter constitute the current judgment of Drawing Capital and are subject to change without notice.