


Happy New Year!
We wish you a healthy and happy new year in 2023.
Before looking ahead into the 2023 year, we would like to share a market recap for 2022. What a year it has been!
We look forward to an exciting 2023.
2022 Stock Market Performance
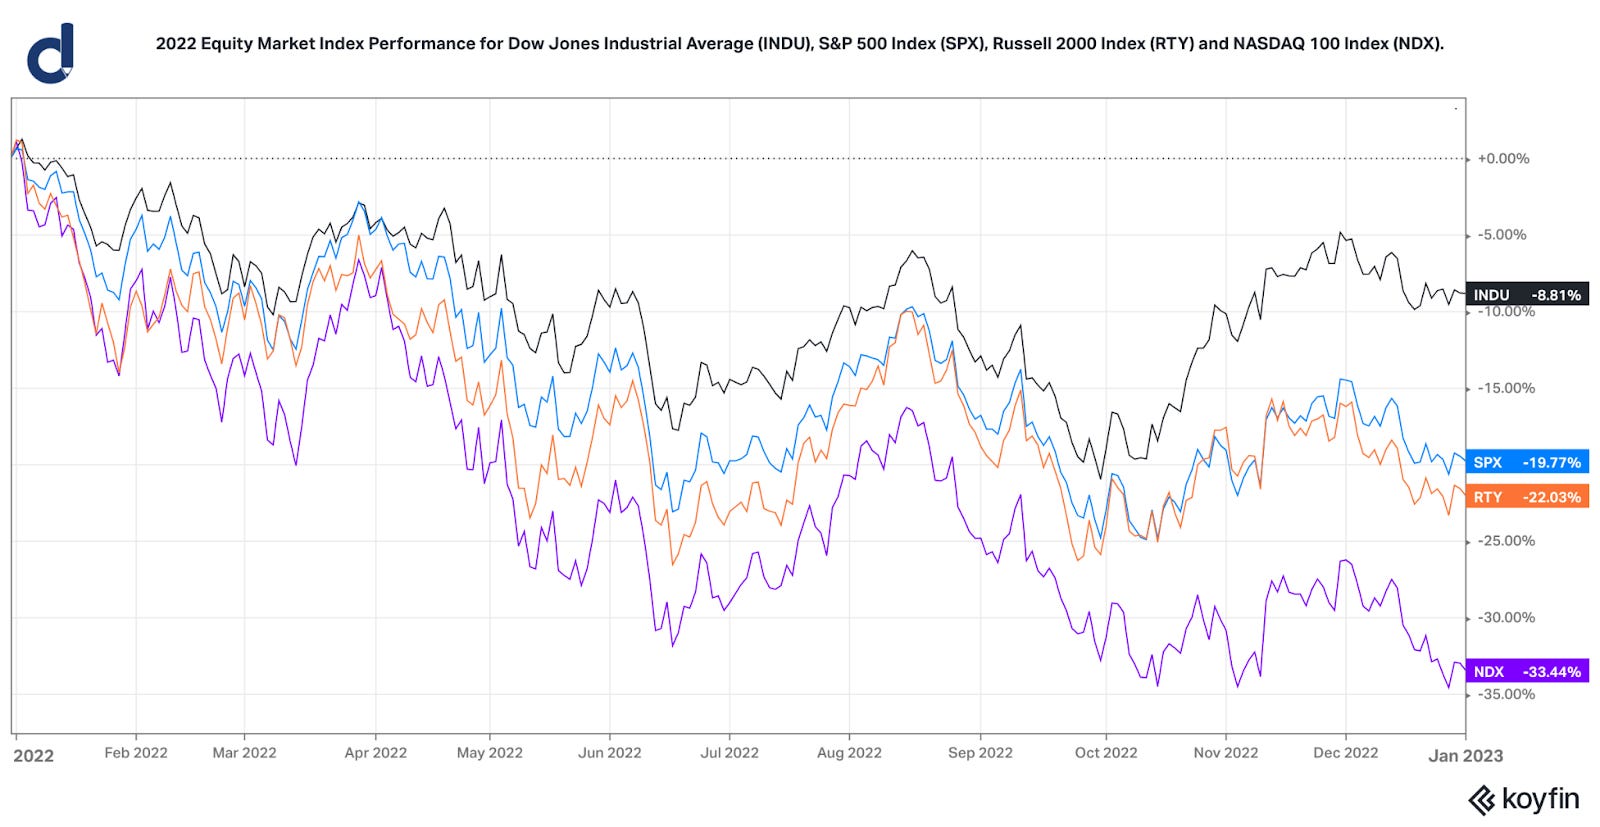
2022 was a tough year for many equity market investors. Four popular US stock market indices (Dow Jones Industrial Average, S&P 500 Index, Russell 2000 Index, and NASDAQ 100 Index) experienced negative price changes in 2022.
The difference in performance between the Dow Jones Industrial Average and the more tech-heavy NASDAQ 100 Index is noteworthy and was about 25% in 2022. The last time that the NASDAQ 100 Index underperformed the Dow Jones Industrial Average by this much was during the 2000-2002 time period, which included the bursting of the internet tech bubble, 9/11, travel & telecom stock drawdowns, and other important events.

Bonds vs. Stocks

Even though several investors perceive bonds as “lower risk” than stocks, long-term Treasury bonds did not provide a particularly useful hedge nor balance to an equity market portfolio in 2022. In fact, popular long-term Treasury bond funds (such as TLT, EDV, and ZROZ) performed worse than Vanguard’s popular S&P 500 Index Fund (ticker symbol: VOO) in 2022.
Rapidly rising interest rates with uncertainty often have greater price impact on long-duration assets, such as long-term bonds, venture capital & startup valuations, and many tech stocks.
Rising Rates and Rising Cost of Capital in 2022

Rising interest rates, rising volatility in interest rates, and rising spreads contributed to rising discount rates. From a discounted cash flow analysis perspective, rising discount rates for the same estimated future cash flows implies a lower current intrinsic value for a stock.
At the end of 2021 with a low interest rate environment, many bond yields were unappealing for many investors, which caused many investors to remain invested in equities. Now, the situation has changed; at the start of 2023, several investors (especially income-focused investors) are finding 4%+ short-term Treasury yields to be interesting, and a portfolio of Treasury bonds and corporate bonds could yield greater than 6%+.
Relationship between Liquidity and Volatility
With the implementation of restrictive monetary policy via balance sheet run-off and raising the target range for the Fed Funds interest rate, there is less liquidity being injected into financial markets. Lower liquidity often corresponds to higher volatility in financial markets.
2022 marked an elevated level of volatility, as seen by both the VIX Index (implied volatility calculation for the S&P 500 Index) and the MOVE Index (volatility indicator for the bond market).
A change in range has occurred in the VIX volatility index, as seen by the chart below. Elevated volatility implies a wider possible range of outcomes and greater uncertainty among market participants. Greater-than-usual price fluctuations can be jarring for investors.

2022 Performance for Innovation Categories
Innovation investing has volatility in investing, and significant price fluctuations can and have occurred. It is common to see double-digit percentage price swings in a calendar year for innovation-category ETFs.
The table below shows the calendar year performances for 2020, 2021, and 2022 for various sample ETFs that seek to track specific innovation categories. Positive price changes are noted in green-shading, and negative price changes are noted in red-shading.
Notably, a common consistency is that all of these sample ETFs performed positively in 2020 yet all of these sample ETFs experienced negative price changes in 2022.
Additionally, changes in monetary policy impact discount rates, which either positively or negatively impact prices of long-duration assets and innovation investment categories. Expansionary monetary policy is often encouraging for innovation investing, while rapid rises in discount rates (as seen in 2022) can be a particularly painful experience along the investment journey for many investors in long-duration assets.

*Note: Performance data is from Morningstar. Data table is organized by Drawing Capital. Performance data contains rounded numbers. The list of sample ETFs is for informational purposes only and is not a solicitation to buy, hold, or sell securities. Future performance can vary from past results.
2022 Dispersion in Sector Performance

In the past decade and reviewing the 11 Vanguard sector ETFs, 2022 was the calendar year with the largest sector dispersion (performance spread) between the best performing sector and worst performing sector. A nearly 100% dispersion in 2022 is massive; the VOX ETF (communication services index fund) fell about -39% while the VDE ETF (energy index fund) gained about 63% in 2022.
Denoted in the black columns in the above chart, there were four instances since 2007 in which the dispersion in sector performance in a calendar year exceeded 50%.
The 11 Vanguard sector ETFs utilized for this analysis include the following ticker symbols: VOX for communication services, VCR for consumer discretionary, VDC for consumer staples, VDE for energy, VFH for financials, VIS for industrials, VHT for healthcare, VGT for technology, VAW for materials, VNQ for real estate & REITs, and VPU for utilities.
From 2007-2022, the average sector dispersion between the worst and best sectors by Vanguard sector ETF performance was about 43%. Said differently, there are historically large differences in sector performance in each calendar year over the past 16 years. Active management in being either over-allocated or under-allocated to a sector can contribute meaningfully to either benchmark-beating performance (alpha) or contribute to performing worse than the S&P 500 Index.
Individual sector performance often deviates from the annual S&P 500 Index performance. There can be benefits from choosing the winning sectors in each calendar year.
Job Market & Payrolls Data
From April 2021 to December 2022, the year-over-year change in nonfarm payrolls fell from about 11% to about 3%. While this deceleration in growth rate is notable, a year-over-year change of 3% remains positive.
In the past 80 years in America, a negative year-over-year change in nonfarm payrolls has coincided with an economic recession, as seen in the chart below and with economic recessions illustrated in the gray-shaded columns. Nonfarm payrolls is a measure of the number of American workers in the economy (plus or minus some specific workforce categorizations).

Source: U.S. Bureau of Labor Statistics and Federal Reserve Economic Database. Link: https://fred.stlouisfed.org/series/PAYEMS
Job Openings
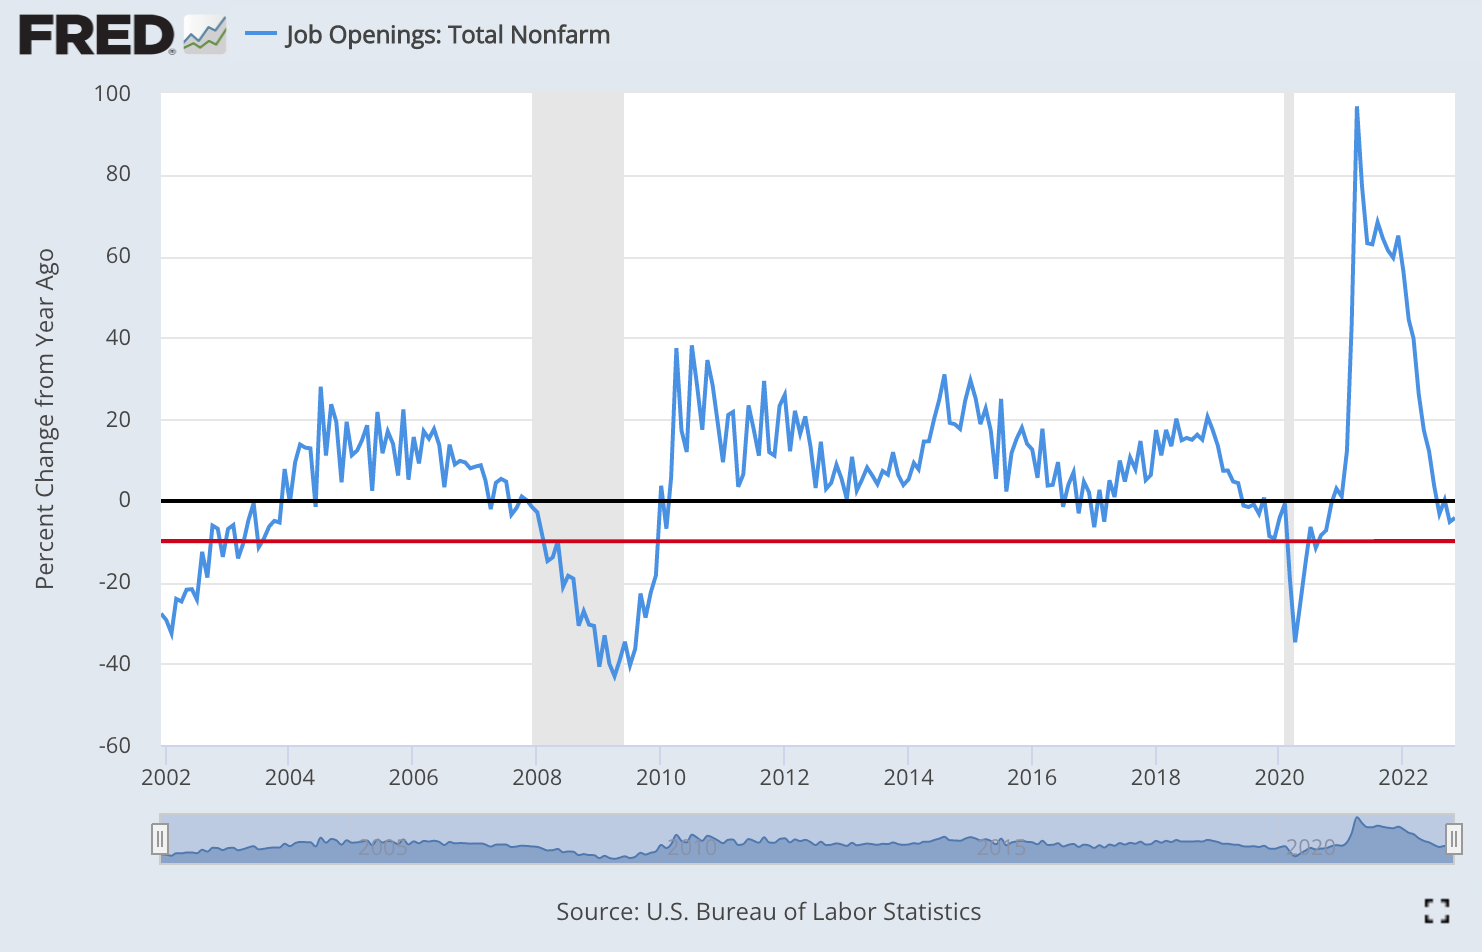
According to the Federal Reserve Economic Database and U.S. Bureau of Labor Statistics, “Total Nonfarm Job Openings are a measure of all jobs that are not filled on the last business day of the month. A job is considered open if a specific position exists and there is work available for it, the job can be started within 30 days, and there is active recruiting for the position. Total Nonfarm Job Openings are measured by the Job Openings and Labor Turnover Survey (JOLTS) and published by the Bureau of Labor Statistics (BLS). These data are a unique economic indicator of unmet demand for labor and labor shortages. Economists, government officials, and researchers use Job Openings as a measure of tightness within job markets.”
In the past 20 years, a year-over-year change in the number of nonfarm job openings worse than -10% has coincided with an economic recession. In November 2022, the year-over-year change in the number of nonfarm job openings was -4.2%.
Source: U.S. Bureau of Labor Statistics and Federal Reserve Economic Database. Link: https://fred.stlouisfed.org/series/JTSJOL
Consumer Strength & Personal Savings
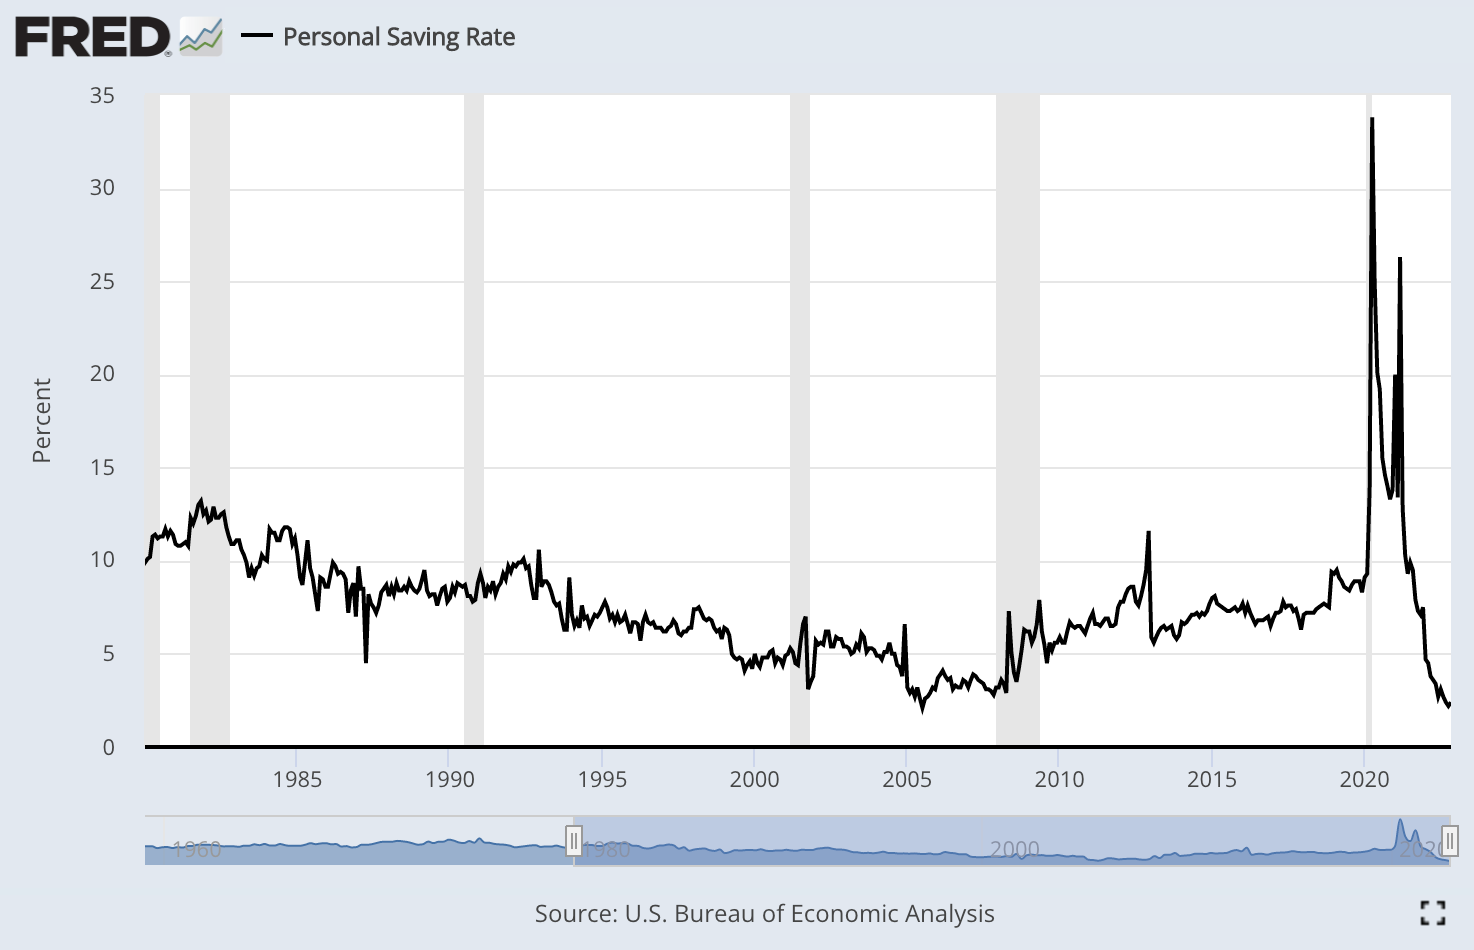
After personal savings surged to over $6.4 trillion in April 2020, personal savings in America declined to below $500 billion in November 2022. Additionally, the personal saving rate fell from 12.8% in April 2021 to 2.2% in October 2022. Rapid reductions in personal savings perhaps may cause lower future growth rates in consumer spending, and consumer spending represents a large portion of total economic activity in America.

___
Sources: U.S. Bureau of Economic Analysis and Federal Reserve Economic Database. Links: https://fred.stlouisfed.org/series/PSAVERT and https://fred.stlouisfed.org/series/PMSAVE
Big Tech Stocks in 2022

__

__

Looking Ahead for 2023
In addition to continuing to study the innovation economy and financial markets, we are reviewing these eight themes in 2023:
The 3 D’s: Digitalization, Decarbonization, and De-globalization
Cyclicality and tailwinds in the semiconductor and chips industries
Inflation uncertainty, interest rates, monetary policy, and market volatility
Stabilization versus drawdowns & dispersion in the bond market
The shift from the TINA Effect (“there is no alternative”) to the TARA Effect (“there are reasonable alternatives”) when making or maintaining investments.
Credit spreads and the VIX Index
Mezzanine financing, convertible bonds, and preferred equity
Risks of a recession: timing (when?), impact (how mild or severe?), duration (how long will it last?)

This letter is not an offer to sell securities of any investment fund or a solicitation of offers to buy any such securities. Any stock, options or futures symbols, companies or investment products displayed are for illustrative purposes only and are not intended to portray recommendations. An investment in any strategy, including the strategy described herein, involves a high degree of risk. Past performance of these strategies is not necessarily indicative of future results. There is the possibility of loss and all investment involves risk including the loss of principal.
Any projections, forecasts and estimates contained in this document are necessarily speculative in nature and are based upon certain assumptions. In addition, matters they describe are subject to known (and unknown) risks, uncertainties and other unpredictable factors, many of which are beyond Drawing Capital’s control. No representations or warranties are made as to the accuracy of such forward-looking statements. It can be expected that some or all of such forward-looking assumptions will not materialize or will vary significantly from actual results. Drawing Capital has no obligation to update, modify or amend this letter or to otherwise notify a reader thereof in the event that any matter stated herein, or any opinion, projection, forecast or estimate set forth herein, changes or subsequently becomes inaccurate.
This letter may not be reproduced in whole or in part without the express consent of Drawing Capital Group, LLC (“Drawing Capital”). The information in this letter was prepared by Drawing Capital and is believed by the Drawing Capital to be reliable and has been obtained from sources believed to be reliable. Drawing Capital makes no representation as to the accuracy or completeness of such information. Opinions, estimates and projections in this letter constitute the current judgment of Drawing Capital and are subject to change without notice.