Introduction
Today’s Drawing Capital newsletter focuses on statistical distribution curves with accompanying real-world historical examples. Specifically, we share thoughts on the following:
Normal vs. Right-Tailed vs. Left-Tailed distributions
Tight-Tailed vs. Fat-Tailed distributions
How do distribution curves change across asset classes and across time horizons?
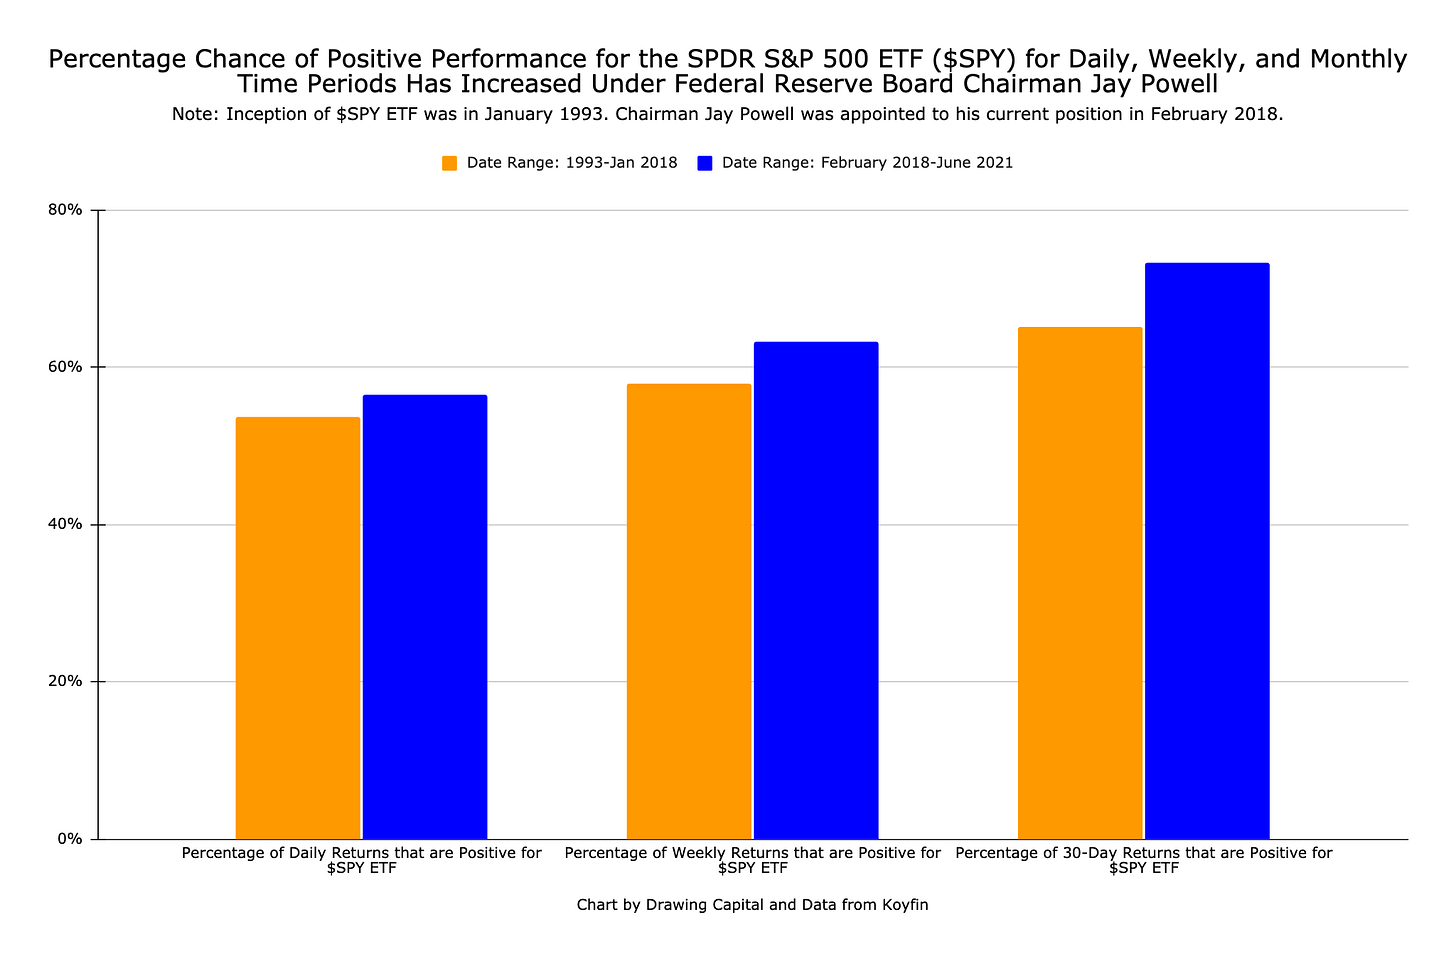
How has the probability of positive performance results for the S&P 500 been affected by Chair Jay Powell at the Federal Reserve?
Case Studies:
What are the key insights from histograms of historical returns for various index funds that track a diversity of investment categories?
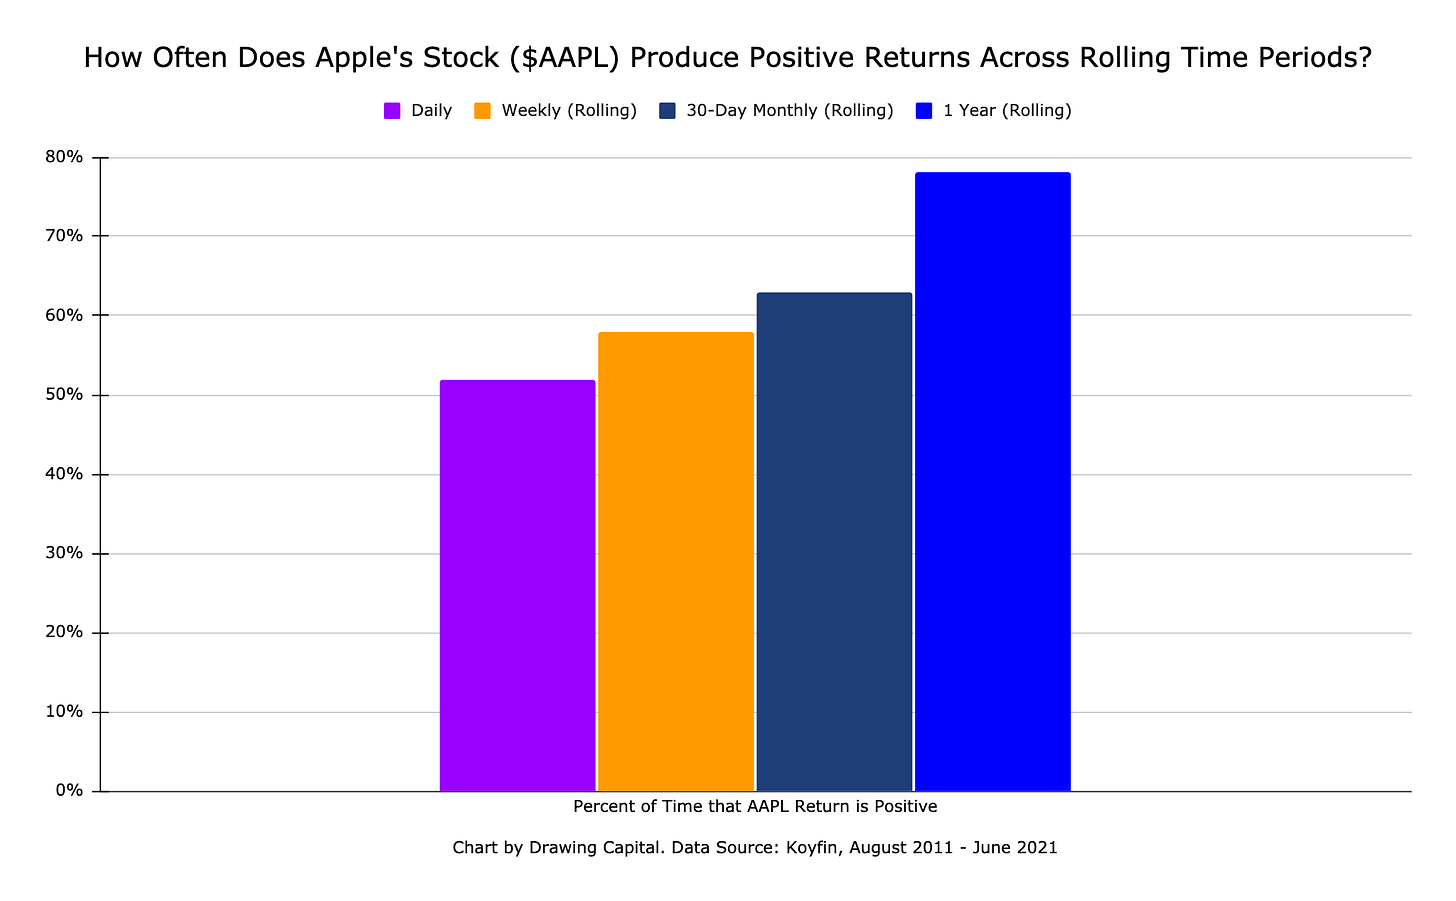
How often does Apple stock produce positive performance returns across varying rolling time horizons?
How does the median stock perform compared to the Russell 3000 Index?
Understanding the return distributions of outcomes can help more investors get the odds of investing success in their favor. Successful growth investors do well in successfully chasing the right tail in the return distribution curve.
Distribution Curves: Right Tail vs. Left Tail
Right-tailed is also known as positive skew and exhibits a long right tail. Left-tailed is also known as negative skew and exhibits a long left tail. A normal distribution curve has a symmetrical shape.
Right-tailed return distributions provide potential positive optionality. The size of the prize matters. Said differently, slugging percentage is more important than batting average in growth investing. Moving rightward along the x-axis has higher returns but lower probability of achieving higher returns.
Left-tailed return distributions have a higher probability of achieving frequent yet small positive results with infrequent yet large negative events. If you avoid the negative outlier events (aka the massive losing positions), then the winners usually take care of themselves because the majority of the investments with left-tailed positive returns typically produce positive returns.
Growth investing, venture capital, and founding a startup are all examples of right-tail distributions, and the magnitude of the victories often are the key drivers of large financial successes. In early-stage venture capital, even if 70% of startups fail, if the winning early-stage investments generate a 100x or 1000x return on investment, then the overall venture capital fund can still generate significant returns to investors.
Corporate bond investing, insurance, and selling put options & call options are examples of left-tail distributions.
Distribution Curves: Tight Tail vs. Fat Tail
Fat-tailed distributions have a wider range of outcomes, therefore implying a larger uncertainty in achieving returns. A wider range of outcomes demonstrates a greater probability of large gains or large losses compared to a tight-tailed distribution.
Tight-tailed distributions have a smaller range of outcomes, therefore implying a higher predictability of outcomes within a certain range.
“Chair Powell Effect” on the S&P 500
Apple Example
Key Insights:
Tim Cook became CEO of Apple in August 2011.
While the historical probability of Apple’s daily stock price delivering a positive return is nearly a coin-flip probability, there was a nearly 78% historical probability of producing a positive return when buying-and-owning Apple shares for 1 year in the measured time period.
Extending the holding period for Apple shares has historically increased the probability of winning, as defined by producing positive returns from owning Apple shares.
Don’t day-trade innovation. Quality tech companies produce recurring benefits and transformative technologies over time that benefit the stakeholder trifecta: consumers, employees, and shareholders.
Index Fund Examples
The above chart displays how longer measurement periods lead to a widening distribution of outcomes (i.e. fatter tails) for the NASDAQ 100 Index ETF (ticker symbol: QQQ). Conceptually, this matches with reality: A lot more uncertain events can happen in a year than in a day.
Key Notes:
Different index funds across different asset classes have different histogram shapes that represent the distribution of outcomes.
Viewing the x-axis, notice how the x-axis for the IEF index fund has significantly smaller increments than the x-axis for the QQQ index fund. Additionally, the variance for QQQ and VNQ are far greater than the LQD and IEF bond funds.
QQQ is an index fund that tracks the NASDAQ 100 Index, which is a basket of stocks with a technology bias.
VNQ is an index fund that tracks a basket of publicly-traded American real estate investment trusts.
LQD is an index fund that tracks a basket of American corporate bonds.
IEF is an index fund that tracks an index for intermediate-term US Treasury bonds.
Key Insights:
Surprisingly, the median excess lifetime returns on individual stocks versus the annualized return on the Russell 3000 Index is negative from 1980-2020.
Simply owning a good Russell 3000 Index fund would have performed better than a significant number of stocks from 1980-2020.
The reason that the Russell 3000 Index has generated positive returns in the long term is because the winning outlier positions (ie. the extreme ends of the right tail) have delivered very significant returns and because the index weighting of the Russell 3000 Index allocates a higher percentage weighting to larger companies.
Concluding Thoughts
Successful growth investors do well in successfully chasing the right tail in the return distribution curve.
Investments in assets with historically fat tails have higher probabilities of extremely positive events and extreme negative events compared to investments in assets with historically tight tails.
Simply making investments in assets with historically tight tails for distribution curves is not a guarantee of low volatility or low uncertainty in the future in a portfolio.
Return distributions typically are not symmetric. Said differently, many return distributions in financial markets exhibit skewed distributions, as seen by right-tailed or left-tailed return distributions.
Return distributions typically are not static, implying that changing return distributions across varying time periods lead to future return distributions deviating from historical return distributions.
Emerging technologies have uncertainty in validity and impact. Be prepared for a rollercoaster ride when being a growth investor that invests in innovative and transformative technologies.
Extending the investment holding period for innovative companies that experience significant growth rates in revenues, cash flows, and customers can often improve both the investing odds and outcomes from these investments. While many Wall Street analysts and retail investors are looking for a quick profit (return on investment) in 3 months or less, this approach completely misses the fact that durable technology platforms generate significant returns to shareholders in the long-run. For example, while earning a quick 12% in 2 months on NVIDIA’s stock is nice, producing a 1200% return by buying-and-holding NVIDIA shares for the past 5 years was much better.
Understanding the return distributions of outcomes can help more investors get the odds of investing success in their favor.
References:
"Koyfin | Advanced graphing and analytical tools for investors." https://app.koyfin.com/
. Accessed 14 Aug. 2021.
“Understanding Investing: Tail Risk”. PIMCO. https://www.pimco.com/en-us/resources/education/understanding-tail-risk. Accessed 14 Aug 2021.
J.P. Morgan | Eye on the Market, The Agony & The Ecstasy Report. 15 Mar. 2021. https://privatebank.jpmorgan.com/content/dam/jpm-wm-aem/global/pb/en/insights/eye-on-the-market/agony-ecstasy-2021.pdf. Accessed 14 Aug 2021.
This letter is not an offer to sell securities of any investment fund or a solicitation of offers to buy any such securities. An investment in any strategy, including the strategy described herein, involves a high degree of risk. Past performance of these strategies is not necessarily indicative of future results. There is the possibility of loss and all investment involves risk including the loss of principal.
Any projections, forecasts and estimates contained in this document are necessarily speculative in nature and are based upon certain assumptions. In addition, matters they describe are subject to known (and unknown) risks, uncertainties and other unpredictable factors, many of which are beyond Drawing Capital’s control. No representations or warranties are made as to the accuracy of such forward-looking statements. It can be expected that some or all of such forward-looking assumptions will not materialize or will vary significantly from actual results. Drawing Capital has no obligation to update, modify or amend this letter or to otherwise notify a reader thereof in the event that any matter stated herein, or any opinion, projection, forecast or estimate set forth herein, changes or subsequently becomes inaccurate.
This letter may not be reproduced in whole or in part without the express consent of Drawing Capital Group, LLC (“Drawing Capital”). The information in this letter was prepared by Drawing Capital and is believed by the Drawing Capital to be reliable and has been obtained from sources believed to be reliable. Drawing Capital makes no representation as to the accuracy or completeness of such information. Opinions, estimates and projections in this letter constitute the current judgment of Drawing Capital and are subject to change without notice.


