Drawing Capital Newsletter
November 6, 2020
In this week’s newsletter, we explore consumer price inflation, financial asset inflation, and the deflationary nature of technology.
Consumer Price Inflation & Financial Asset Inflation
In America, residential rent prices, healthcare costs, and education tuition & childcare costs have all increased at a faster rate than the US consumer price index, which is a broad measure of inflation for a basket of consumer goods. Surprisingly, on a national level from 1990-July 2020, home prices underperformed the growth in education tuition & childcare costs.
Data Source: Federal Reserve Economic Database and Yahoo Finance (1, 2)
Decline in Purchasing Power
If an asset class is appreciating in value in US Dollar terms, then as a corollary, this implies that the US Dollar is depreciating in value relative to these asset classes or categories. The purchasing power of the US Dollar has declined in the past 30 years when compared to the following categories.
Data Source: Federal Reserve Economic Database and Yahoo Finance (1, 2)
The above chart displays how the purchasing power of $1,000 has declined over time. For example, in the start of 1990, you could buy about 3 “units” of the S&P 500 Index for $1,000. Today, $1,000 only buys you about 0.3 “units” of the S&P 500 Index.
Money Supply & Velocity of Money
By definition from the Federal Reserve (3), M2 money supply consists of “M1 money supply plus
savings deposits (including money market deposit accounts)
small-denomination time deposits (time deposits in amounts of less than $100,000) less individual retirement account (IRA) and Keogh balances at depository institutions
balances in retail money market mutual funds less IRA and Keogh balances at money market mutual funds.”
As defined by the Federal Reserve (3), M1 money supply consists of the following:
“currency outside the U.S. Treasury, Federal Reserve Banks, and the vaults of depository institutions
demand deposits at commercial banks (excluding those amounts held by depository institutions, the U.S. government, and foreign banks and official institutions) less cash items in the process of collection and Federal Reserve float
other checkable deposits consisting of negotiable order of withdrawal and automatic transfer services, accounts at depository institutions, credit union share draft accounts, and demand deposits at thrift institutions.”
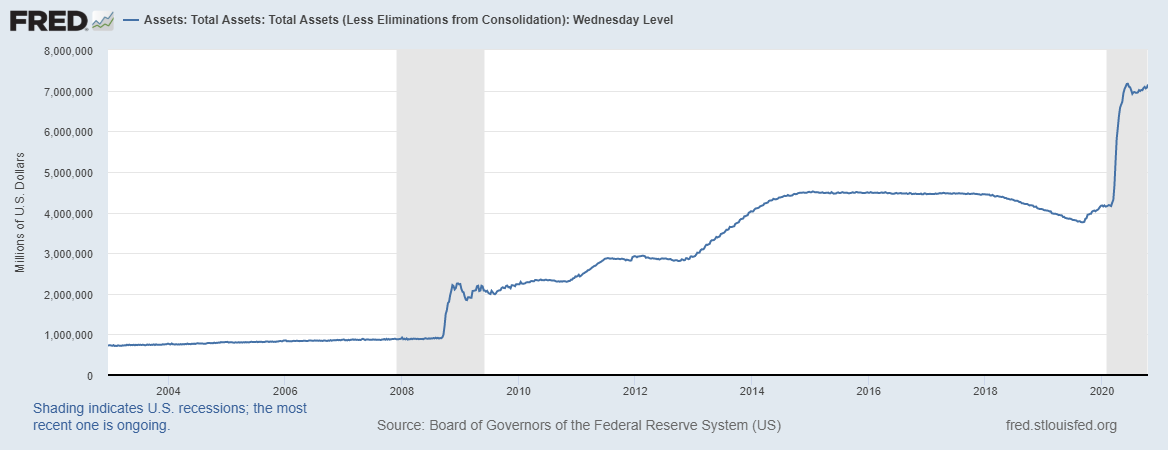
The following charts from the Federal Reserve Economic Database highlight the growth in the Federal Reserve’s balance sheet, the upward trend of M2 money supply, the declining trend of M2 money velocity since 1980, and the historical relationship between the consumer price inflation index (CPI) and M2 money velocity. We will explore the impacts of these trends and relationships further below.
Key Insights on Consumer Price Inflation & Financial Asset Inflation
Inflation represents a decrease in purchasing power; i.e. the US Dollar is depreciating relative to the consumer price index and several types of financial assets, which implies that more US Dollars are needed to purchase the same amount of goods or services.
Major US equity indices and American real estate appear to be better stores of value in the long term compared to the US Dollar.
M2 velocity of money (not M2 money supply) is a leading indicator for consumer price inflation. The M2 velocity of money has been trending lower for quite some time. As a result, the extraordinary trillions of dollars in monetary stimulus from central banks typically will not lead to high inflation rates in consumer prices unless the monetary stimulus leaves the financial community and enters the hands of American consumers and businesses for productive economic purposes, where the money can be circulated, used, and spent.
In the past 10 years, M2 money supply has increased by more than 2x, while the S&P 500 Index has increased by more than 3x. Even though the S&P 500 Index has increased by more than 3x over the past 10 years, operating earnings per share of S&P 500 companies have only increased about 1.5x over the past 10 years (1,2,4).
People experience inflation at different inflation rates, depending on their current position in life, consumption patterns, investment patterns, and future planned expenditures. As a result, the aggregated US Consumer Price Index (CPI) is not necessarily reflective of one’s own personal inflation rate.
In a world with extraordinary monetary stimulus and “money printing” from central banks, the inflation rate on financial assets often exceeds the inflation rate on consumer prices. Forcing inflation through printing money leads to monetary debasement.
Economic nationalism and de-globalization policies typically will increase inflation and wage growth.
When interest rates earned on cash balances are less than inflation rates, holding high cash balances for extended periods of time reduces its purchasing power.
Maintaining a low interest rate policy is the monetary equivalent of “trickle-down economics”. Inflation is a regressive tax, and financial asset inflation increases wealth inequality. Individuals and institutions that participate in financial markets can earn returns, which do not necessarily trickle down enough to the general economy and to the average American consumer.
There are four methods of managing debt:
repay the debt
restructure the debt
default on the debt
devalue the currency to finance the debt
If the first three methods are considered untenable for US Treasuries (the debt of the US federal government), then only the 4th method remains, which requires devaluing the US Dollar to finance the debt over time.
The Federal Reserve creates money, and the US Treasury physically prints money. If the Federal Reserve’s quantitative easing programs are asset-swapping US Dollars for financial assets (such as US Treasury bonds), then there is little perceived impact of quantitative easing on consumer price inflation and high perceived impact on financial asset inflation.
The American economy is a consumption-driven economy. Marginal propensity to consume (“mpc”) measures an individual’s consumption patterns when given an extra dollar. A high mpc implies that an individual will spend the majority of an extra dollar that is given to the individual. For example, if mpc = 0.8, then an individual will spend 80 cents of every extra dollar that is given to that individual. A low mpc implies that an individual will save the majority of an extra dollar that is given to the individual. In order to efficiently stimulate the economy, it is important for policymakers to identify and direct money into the hands of individuals with a high marginal propensity to consume as opposed to individuals with a high marginal propensity to save.
If consumer price inflation occurs, it will come from fiscal stimulus and the US Treasury’s stimulus programs, in which money is being printed or financed by budget deficits and being directed towards small business owners, individuals, and corporations. If the US Treasury printed money and gave it to every American for the purposes of spending the money, then this would cause M2 money velocity and consumer price inflation to both rise.
Technological Advancement & Engineering Laws
Conceptually, technological deflation involves receiving more for less. Many technologies and products exist today such that delaying purchasing gratification leads to lower future prices for the same product or a better product for the same price. For example, for every annual iteration of the iPhone, the previous iPhone versions command lower prices.
The following chart from Ray Kurzweil, Steve Jurvetson, and Future Ventures highlight technological progress regarding computational power per constant dollar (5).
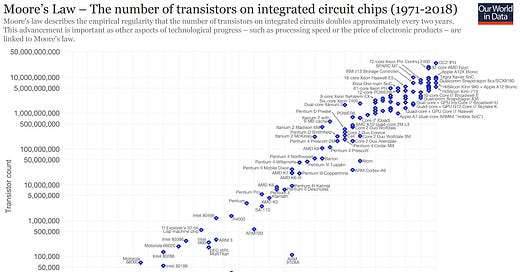
Moore’s Law is one of the more famous engineering laws, which states that for every two years, the cost of computers halves and the number of transistors doubles. The following chart from Our World In Data displays the advancement of chips over time (6).
Beyond Moore’s Law and applying the technological innovation curve towards a range of technological advancements, we find numerous engineering laws that can apply to past and future human progress. For example:
Wright’s Law: For every 2x in cumulative production, production costs fall at a constant percentage.
Haitz’s Law: For every 10 years, LED brightness increases by 20x, and the cost to manufacture LEDs decreases by 10x.
Swanson’s Law: For every 2x in cumulative shipped volume, the average price of solar photovoltaic modules drop by 20%.
Carlson Curve: For every 2 years, the dollar cost to sequence a human genome decreases, and the productive output in sequencing a genome increases at a faster rate than Moore’s Law.
Beckstrom’s Law: With a summation across all users, the value of a network is equivalent to the net added value of each user’s transactions and usage that is done within the network.
Key Insights on Technological Deflation
The greater the technological deflation by a company, the greater the possible inflated nature and perceived value of the company’s stock price and value creation. Technology is a deflationary force, and innovation that drives large productivity growth combats inflation.
Companies that provide products and services that are better, faster, cheaper, and more convenient for consumers compared to competitors generally tend to stay in business and grow over time.
An increasing number of companies are providing “free” products and services to consumers. “Free” is in quotes since each of these companies indirectly monetizes the “free” component of their “free” products and services. For example, Google provides “free” search, email, web browser, video media consumption, and other free services to consumers. Robinhood and E-Trade provide “commission-free” stock trading. Facebook provides “free” worldwide messaging and social media content to consumers.
Based on the research of Professor Alberto Cavallo at Harvard University regarding the “Amazon Effect”, Amazon has single-handedly impacted consumer retail markets by increasing price uniformity, making online prices more sensitive to change due to competitive forces, and altering the price level of certain goods and services for the benefit of consumers. (7)
References:
(1) "FRED - Federal Reserve Bank of St. Louis." https://fred.stlouisfed.org/. Accessed 21 Oct. 2020.
(2) "S&P 500 (^GSPC) Historical Data - Yahoo ...." https://finance.yahoo.com/quote/%5EGSPC/history/. Accessed 21 Oct. 2020.
(3) "Money Stock Measures - H.6 Release ...." https://www.federalreserve.gov/releases/h6/current/default.htm. Accessed 30 Oct. 2020.
(4) "S&P 500 Earnings and Estimate Report - S&P Global." https://www.spglobal.com/spdji/en/documents/additional-material/sp-500-eps-est.xlsx?force_download=true. Accessed 24 Oct. 2020.
(5) “Steve Jurvetson: Forging the Future: What’s Next?”. Silicon Valley Open Doors. https://www.youtube.com/watch?v=zGN6dR5ZeSg. 8 Jun 2018. Accessed 21 Oct. 2020.
(6) "Animation: Visualizing Moore's Law in Action (1971-2019)." 9 Dec. 2019, https://www.visualcapitalist.com/visualizing-moores-law-in-action-1971-2019/. Accessed 21 Oct. 2020.
(7) "More Amazon Effects: Online Competition and Pricing Behaviors." https://www.hbs.edu/faculty/Publication%20Files/Cavallo_Alberto_J2_More%20Amazon%20Effects-Online%20Competition%20and%20Pricing%20Behaviors_61ab3273-d446-4dd5-9e71-469c54c46662.pdf. Accessed 21 Oct. 2020.
This letter may not be reproduced in whole or in part without the express consent of Drawing Capital Group, LLC (“Drawing Capital”). This letter is not an offer to sell securities of any investment fund or a solicitation of offers to buy any such securities. An investment in any strategy, including the strategy described herein, involves a high degree of risk. Past performance of these strategies is not necessarily indicative of future results. There is the possibility of loss and all investment involves risk including the loss of principal.
The information in this letter was prepared by Drawing Capital and is believed by the Drawing Capital to be reliable and has been obtained from sources believed to be reliable. Drawing Capital makes no representation as to the accuracy or completeness of such information. Opinions, estimates and projections in this letter constitute the current judgment of Drawing Capital and are subject to change without notice.
Any projections, forecasts and estimates contained in this document are necessarily speculative in nature and are based upon certain assumptions. In addition, matters they describe are subject to known (and unknown) risks, uncertainties and other unpredictable factors, many of which are beyond Drawing Capital’s control. No representations or warranties are made as to the accuracy of such forward-looking statements. It can be expected that some or all of such forward-looking assumptions will not materialize or will vary significantly from actual results. Drawing Capital has no obligation to update, modify or amend this letter or to otherwise notify a reader thereof in the event that any matter stated herein, or any opinion, projection, forecast or estimate set forth herein, changes or subsequently becomes inaccurate.


