


Exponential Growth Opportunities
Weekly updates on the innovation economy.

Happy Friday! In today’s newsletter, we share ideas and insights in power laws, 10X investment opportunity frameworks, the power of compounding returns, and differences in compounding growth versus linear growth.
In our opinion, the key takeaway is that understanding both the historical distribution of outcomes and current risk-reward trade offs, along with historical data and investment frameworks, can be helpful in building an investment portfolio. We hope you enjoy this informative topic.
Academic Research Supports the Concept of “Power Laws” in Public Stock Market Investment Returns
Power laws occur in various academic fields. In finance and portfolio management, one interpretation of power laws is that within a portfolio, a small number of investments often can be responsible for explaining a significant part of the portfolio’s total return.
To further explore power law investing in the public stock market, we sourced the following four thought-provoking quotes and notable figures from an academic research paper that was written last year that analyzed historical investment returns from 1990 to 2020. [The title, authors, publishing date, and link for this academic paper can be found below in the references section].

The key conclusion is that wealth creation is highly concentrated, and only a minority of companies generate the overwhelming majority of long-term positive investment returns.
Investor Implications in Power Laws

These 6 topics highlight important investor implications related to understanding power laws and its applications to investment decisions and investment returns.
Historical Return Analysis from J.P. Morgan Asset Management Regarding Excess Returns

The key insight from this illustration from JP Morgan is that the winners generate enormous excess returns, while the median stock historically performs worse than the Russell 3000 Index.
Baseball Analogy for Investing: Batting Average versus Slugging Percentage
Varying investment strategies often have varying investment returns, and it’s helpful for several investors to reference the mental model from baseball of “batting average versus slugging percentage”.
Are you aiming for recurring & repeatable returns or investing for high growth potential?
Good investors understand their maximum loss, likelihood of loss (risk), and model multiple scenarios for upside potential.
Batting average is calculated by dividing a player's hits by his total at-bats.
Slugging percentage measures the total number of bases a player records per at-bat.

Notably, and from the above table and scenario above, there are 3 key insights from the hypothetical “growth investing portfolio”:
$1 was each invested into 10 investments to invest a total of $10. The outcome of the sample scenario in the “growth portfolio” yielded an ending portfolio value of $20.50 ($10+$6+$1+$3.5 = $20.50), which equates to a 105% cumulative gain in the portfolio.
Despite 70% of the investments losing value, this portfolio more than doubled its value by investing in these 10 investments.
The investment that generated a 10x return was a “Fund Maker”, because the dollar value from this singular investment paid for the portfolio’s cost basis and represents almost half of the portfolio’s ending value.
Positive & Negative Asymmetries in Investing
Example 1: If you invest $100 into a stock with the expectation that it will go to $150, then your max loss is $100 and your max gain is $50. This is a downwardly asymmetric bet. When investing in securities through downwardly asymmetric bets, the winning percentage (“batting average”) matters. Investment grade bond investing and financially-oriented value investing in equity markets are often examples of securities with negative asymmetry.
Example 2: If you invest $100 into a stock with the expectation that it will go to $350, then your max loss is $100 and your max gain is $250. This is an upwardly asymmetric bet in which the max potential upside is significantly higher than the maximum potential loss. When investing in securities through upwardly asymmetric bets, the weighted average (“slugging percentage”) matters. Early-stage venture capital and growth investing involve making investments with positive asymmetries.
Pathway for Circles of Excellence & Expansion

In many examples, enduring and thriving companies are the ones that can successfully create products from ideas, then create platforms & ecosystems, and then create franchises from these platforms. The ability to level up from one category to the next reduces perceived business risk, and risk reduction leads to value creation.
Business Strategy: Circles of Corporate Excellence & Excellence

Expanding on the illustration above, we further expand on these 5 steps in the descriptions below:
Build: Build 1 product that becomes a category leader
Product Market Fit: Improve the product offering over time to improve sales, create better customer experiences, and reply to customer feedback. Pivot or improve the product approach until strong product market fit is achieved.
Expansion: Based on positive customer feedback and customer demand, earn the right to expand the product offering and/or form new circles of excellence and expansion. Importantly, step 3 should not occur until steps 1 and 2 are accomplished. Said differently, if you haven't achieved success in 1 area, you haven't earned the right to expand, and spreading out too thin reduces focus and lowers the excellence.
Transition from Product to Platform: Transform ideas into products and a suite of products into a platform. Platforms with positive network effects, positive unit economies, and a virtuous data cycle can benefit from accumulating business advantages at scale.
Hyperscale the Business: Pursue growth opportunities. Continue to develop and improve product quality, business sales cycles, talent acquisition & retention, and corporate capital allocation decisions. Make thoughtful decisions about building products in-house vs. buying other companies.
In many instances, Big Tech/FANGMAN companies and other successful companies utilized the business strategy of “circles with excellence and expansion” to create enormous value: hyper-focus on 1 product category, become the category leader, and then earn the right to “land and expand” by building more products or creating new concentric circles via additional business segments in order to grow revenues and expand total addressable markets. For example, Amazon first started selling books online, then expanded its e-commerce retail platforms, then launched Amazon Web Services (AWS), and now is rapidly expanding into other industries after achieving significant market share in e-commerce and cloud computing infrastructure.
Identifying Exponential Growth Opportunities with the High Growth Triangle Framework

Drawing Capital is focused on investing in the innovation economy. We make investments in companies that have the opportunity to experience exponential growth via the intersection of a technological inflection point, exceptional leadership, and a unique circumstance or insight. The High Growth Triangle visualizes the connection between these 3 traits in an effort to provide a high-level qualitative investment framework. As a result of investing in the innovation economy and with a large emphasis on high-growth software, e-commerce, and healthcare technology industries, Drawing Capital is routinely looking for positive asymmetries and exponential growth opportunities.
10 Popular Themes in 10X Investment Opportunities
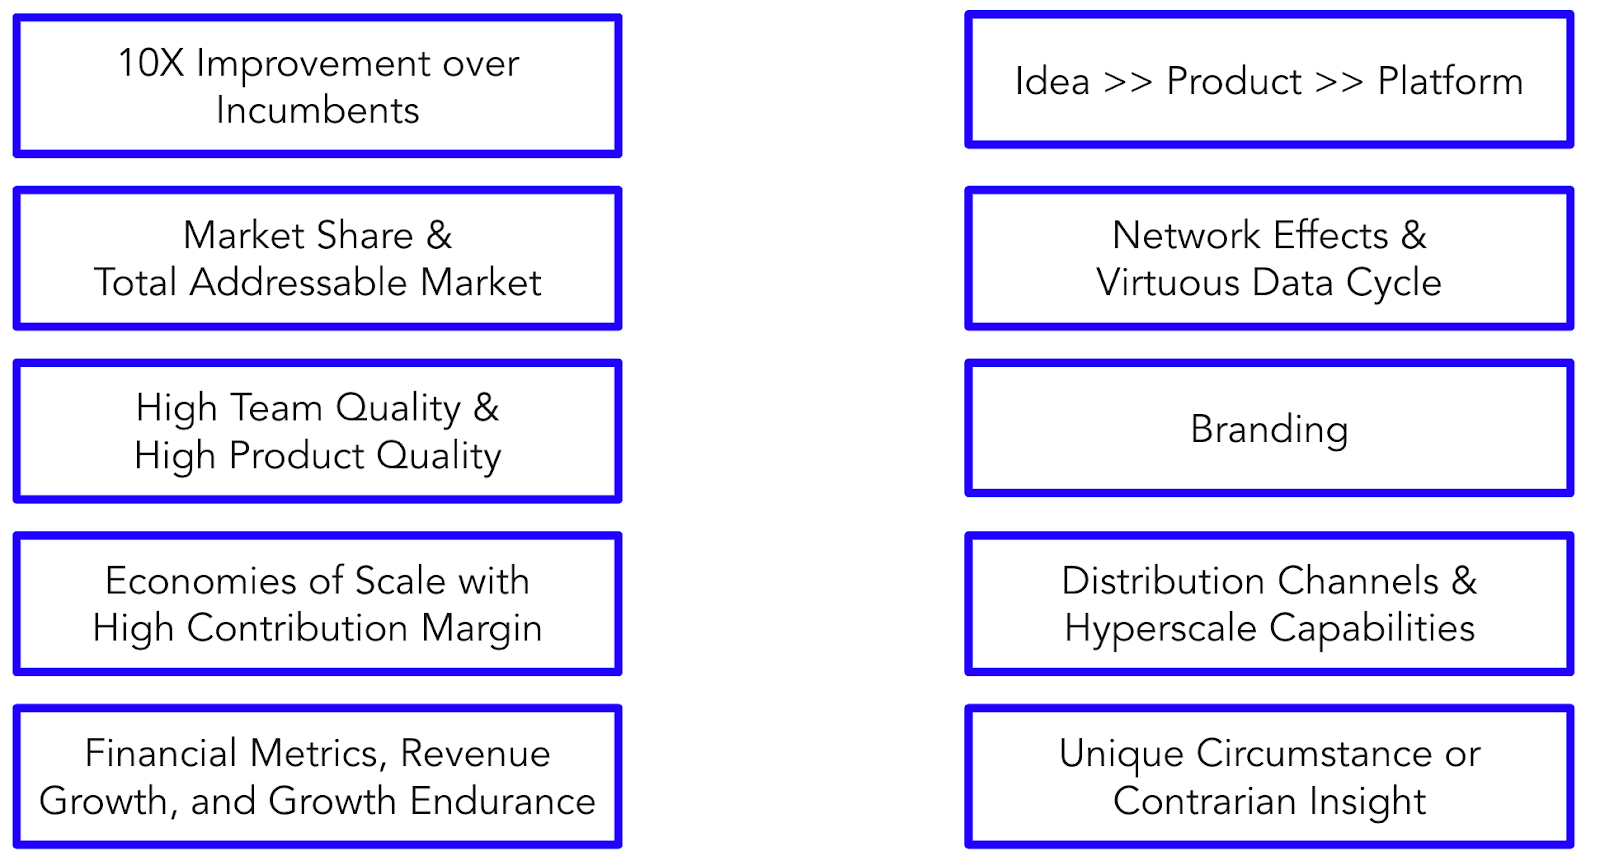
The above illustration highlights ten themes that are commonly found as a framework for seeking potential 10x investment opportunities. We derived these ten themes from analyzing previous industry research and noticing commonalities in specific traits in companies that have more than 10x’d their stock price over the past decade.
Of course, a disclosure or disclaimer note is important in that while 10x opportunities are nice to earn, there are no guarantees in investing, and many high-growth opportunities often come with higher price fluctuation and volatility as a package deal. At the same time, simply seeking high-risk investments does not necessarily imply a high return-producing investment, and future returns can vary when compared to historical performance. Therefore, adding volatility to a portfolio increases the likelihood of a wider distribution of outcomes.
3 Case Studies for Compounding Returns
Compounding Returns Case Study #1:
For the first case study in this section, suppose an investor had a hypothetical example of investing an initial $100,000 investment with a 20% return over 20 years, with the choice of either 20% compounding returns or 20% linear returns.

As you can see, the difference between compounding returns and linear returns is quite significant.
In a linear return scenario that generates 20% from a $100,000 initial investment, the the annual return would hypothetically be $20,000 per year. In contrast, with a compounding annual return scenario, a hypothetical $100,000 initial investment that had a compounded annual growth rate of 20% for 20 years before taxes and fees amounts to about $3.8 million, or a huge 38 times return on initial investment.
Compounding Returns Case Study #2:
A second case study highlights the power of compounding. Suppose you had a hypothetical choice of either having a nickel compounded daily at 5% or receiving $2 million in 1 year. Which would you choose?

For some people, the choice or outcome might be counterintuitive or surprising, which highlights the power of compounding returns.
Compounding Returns Case Study #3:
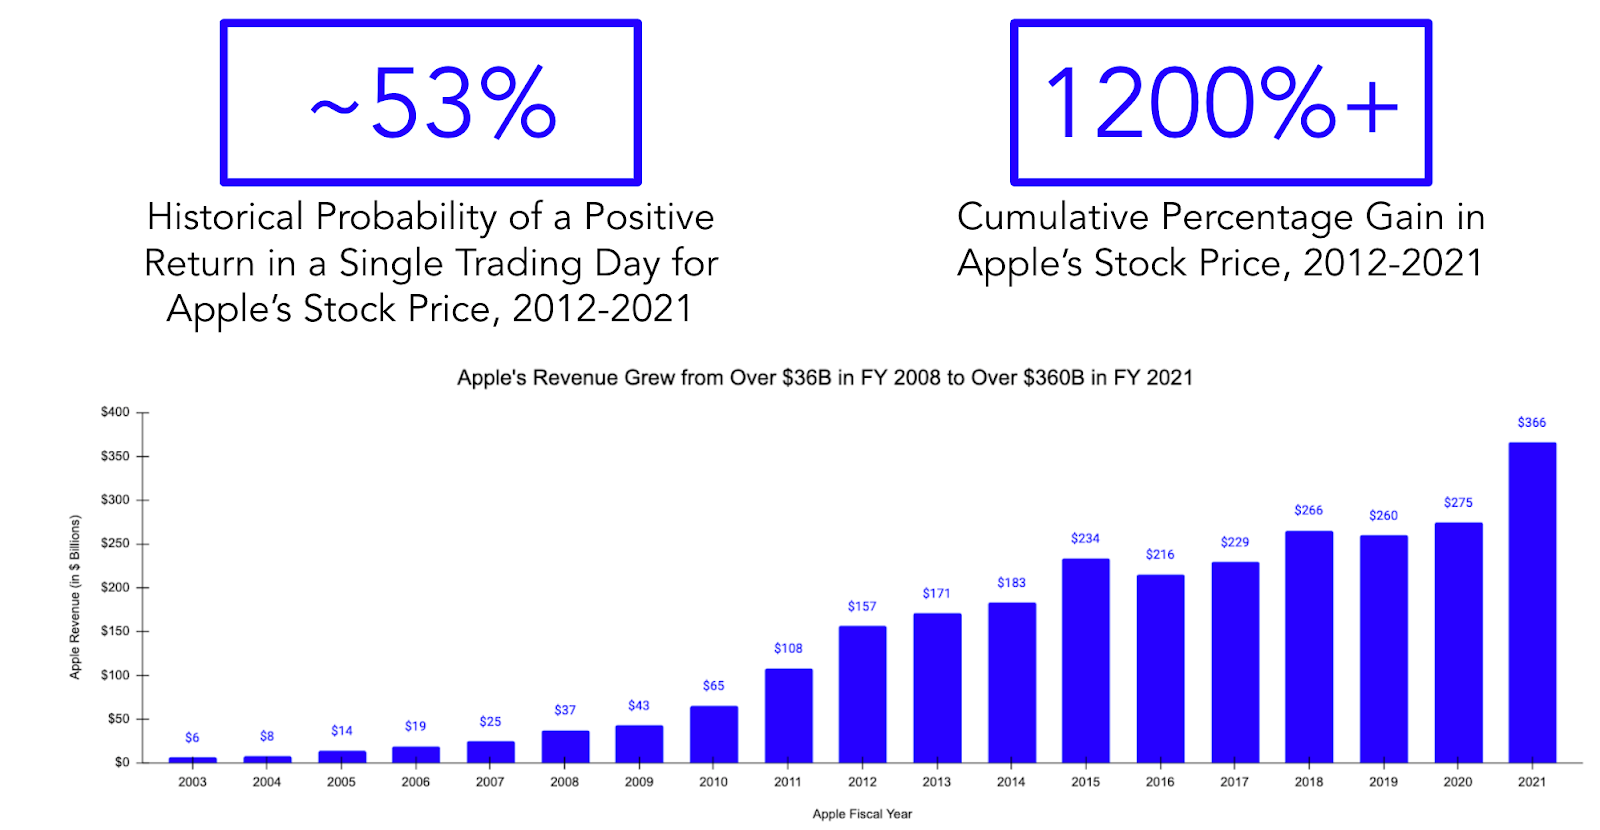
Based on the above illustration, this Apple case study highlights that excessive focus on short-term price movements may perhaps cause investors to miss out on fundamental long-term value creation. From 2012-2021, the probability of Apple’s stock price experiencing positive performance in a single trading day was marginally better than a coin-flip’s probability; yet, the cumulative gain in Apple’s stock price from 2012-2021 has been incredibly significant to long-term Apple shareholders. Extrapolating from this Apple case study and additional market observations, we summarize six key takeaways:
Innovation and transformative technology take time to develop, market, and scale over time.
Day-trading long-term innovation is perhaps not the best approach for seeking long-term, tax-efficient performance returns.
Solving big problems can lead to big value creation for society and big financial gains.
Innovation investing follows power laws and is a form of positive asymmetry investing. One method of identifying this trait is via the following phrase, “this may not work, but if it does, the outcome could be huge”.
Innovation investing requires acceptance of ambiguity and uncertainty in outcomes. It's tough to answer, "how big can this possibly be?" when investing in the early stages. In the case of Apple, when Apple launched the iPhone and iOS app store many years ago, who may have thought that the outcome could reach a $30 billion, $300 billion, or even $3 trillion outcome in market cap?
Ambiguity and uncertainty in outcomes leads to price volatility. In Apple’s case and despite the splendid historical stock performance, Apple’s stock price has experienced multiple 10%+ price drawdowns from peak prices in the past decade, thereby implying the fact that stock price charts of innovative companies are rarely “up and to the right at all times”. Innovation investing unfortunately suffers from higher price volatility through a variety of causes:
Risk-off sentiment and negative macroeconomic sentiment can cause investors to decrease time horizons and re-allocate more money away from risky/unknown/uncertain investments and towards assets that are more considered "known payoffs & return distributions".
Risk-off sentiment reduces price multiples, while risk-on liquidity-fueled rallies can cause surges in price multiples (valuations).
Real innovation is transformative, not incremental, thereby creating the potential for exponential growth. The development of innovative technologies can experience setbacks along the innovation journey, which contributes to price volatility because setbacks increase uncertainty, and many investors typically despise uncertainty and favor certainty.
Charts for Highlighting the Power of Compounding Returns

Key Insight: There is a positive relationship between higher CAGR and higher MOIC. CAGR = compounded annual growth rate, and MOIC = multiple on invested capital. From a “working backwards” perspective by first identifying the goal and then creating a roadmap to achieving the goal, if an investor desires a 10x investment return in 10 years, this goal implies a nearly 26% CAGR.

Key Insight: There is an inverse relationship between CAGR and investment time horizon for generating the same dollar return. Said differently, a higher return aids in accelerating the time to achieve a financial goal.
For example, a 5.25% portfolio CAGR implies a 10x return in about 45 years, while a 9.65% portfolio CAGR implies a 10x return in 25 years, thereby cutting down the time to achieve a 10x return by 20 years in this example.
For example, a 5% portfolio CAGR for 10 years implies a 1.6x investment multiple, while a 15% portfolio CAGR for 10 years implies a 4x investment multiple.

Key Insight: The investment multiple increases with more years of positive compounding returns, and higher annualized rates of return lead to higher investment multiples. For example, a 15% CAGR over 5 years leads to doubling the initial investment, while a 15% CAGR over 10 years leads to quadrupling the initial investment.

Key Insight: The above chart illustrates the connection between loss recovery and breakeven analysis, with the key takeaway being that larger percentage losses require larger percentage gains to breakeven. On a related note, this chart helps to highlight the importance of both risk management in investment portfolios and monitoring price drawdowns during the investment journey.
Analysis of Revenue Growth Rates of S&P 500 Index Companies

Key Insight: Based on historical data as of February 18, 2022, only a select group of 23 companies in the S&P 500 Index have 25%+ compounded annual growth rates in corporate revenue over the past 5 years.
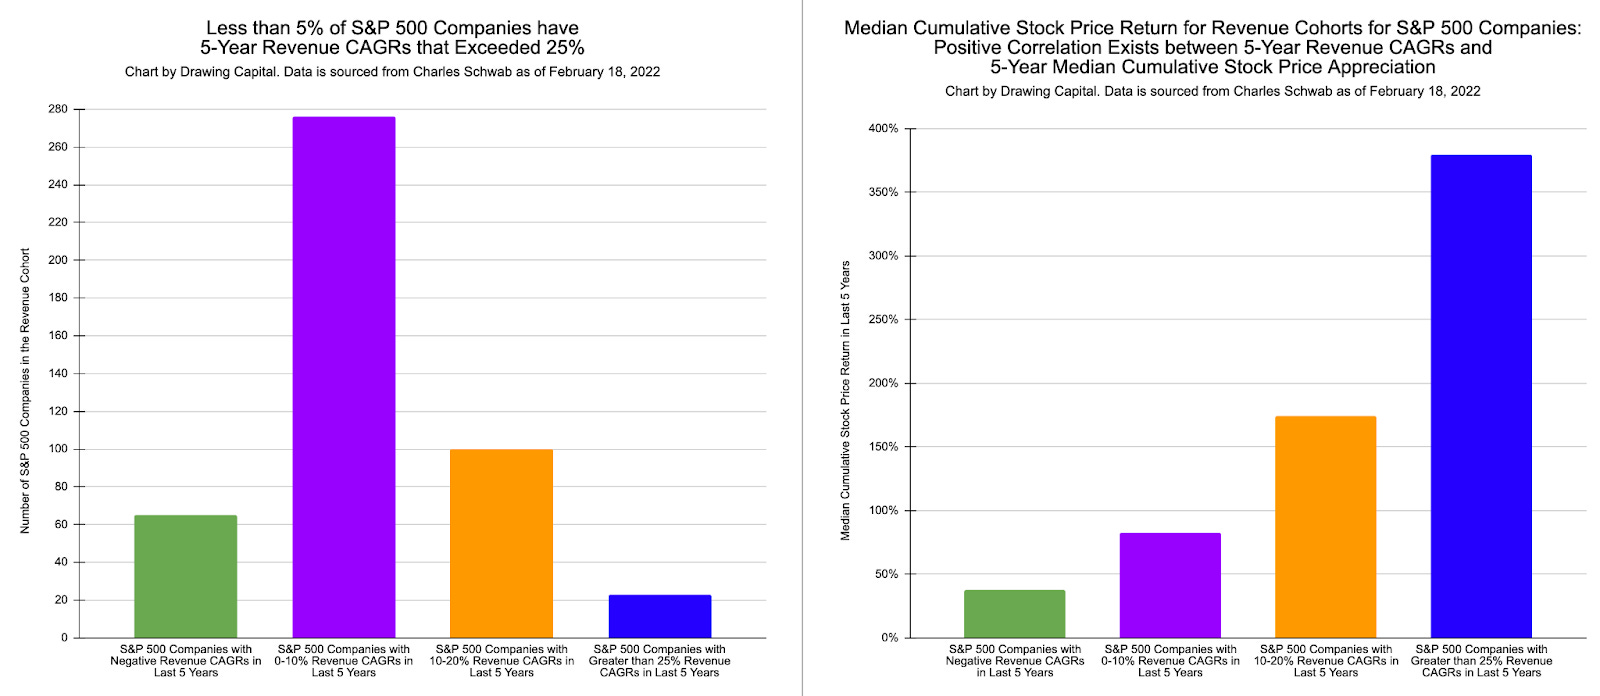
Key Insight: There is a lot of data presented in this two-part illustration, with several possible conclusions. One key takeaway is that historically over a 5-year time horizon, companies with higher revenue growth rates often experienced higher stock price appreciation.
Summary
Data-informed decision-making creates a framework for allocating investments in a portfolio. Successful investing is about identifying, investing in, and correctly sizing good investments in a portfolio.
Most investment returns are not equally distributed. Power laws are prevalent in investing (particularly in equity investments and in the distribution of venture capital returns), and understanding them can improve efficiency in investment research & productive output in investment returns.
Many investors look at the distribution of probabilities, while many entrepreneurs look at the distribution of possibilities. Said differently, many investors look at what can go wrong (risk management), while many entrepreneurs look at what can go right (outcome management).
Exponential growth is a powerful force. Higher compounding returns lead to higher investment multiples over time.
Premium assets that trade at distressed prices can be an investment opportunity. On the flip side, buying distressed assets at premium prices may lead to lousy outcomes. Since return is calculated as the delta between price paid and price sold, price matters in investing.
There exists a correlation between high revenue growth & cash flow and stock price appreciation.
When successful, the outcomes from growth investing and investing in innovative technologies can be spectacularly significant, especially when maintaining a long-term investment focus.
Equity markets are not zero-sum. Multiple stakeholders such as companies, employees, governments, and shareholders can benefit from a rising stock price.

References:
“Long-Term Shareholder Returns: Evidence from 64,000 Global Stocks” by Hendrik Bessembinder, Te-Feng Chen, Goeun Choi, and K.C. John Wei, August 27, 2021, https://papers.ssrn.com/sol3/papers.cfm?abstract_id=3710251
J.P. Morgan Asset Management’s “Eye on the Market” Report Published on March 15, 2021. Source Link: https://privatebank.jpmorgan.com/content/dam/jpm-wm-aem/global/pb/en/insights/eye-on-the-market/agony-ecstasy-2021.pdf
Stock Screener Research by Charles Schwab, https://www.schwab.com/research/stocks/tools/screener
Koyfin, https://www.koyfin.com/
This letter is not an offer to sell securities of any investment fund or a solicitation of offers to buy any such securities. Any stock, options or futures symbols, companies or investment products displayed are for illustrative purposes only and are not intended to portray recommendations. An investment in any strategy, including the strategy described herein, involves a high degree of risk. Past performance of these strategies is not necessarily indicative of future results. There is the possibility of loss and all investment involves risk including the loss of principal.
Any projections, forecasts and estimates contained in this document are necessarily speculative in nature and are based upon certain assumptions. In addition, matters they describe are subject to known (and unknown) risks, uncertainties and other unpredictable factors, many of which are beyond Drawing Capital’s control. No representations or warranties are made as to the accuracy of such forward-looking statements. It can be expected that some or all of such forward-looking assumptions will not materialize or will vary significantly from actual results. Drawing Capital has no obligation to update, modify or amend this letter or to otherwise notify a reader thereof in the event that any matter stated herein, or any opinion, projection, forecast or estimate set forth herein, changes or subsequently becomes inaccurate.
This letter may not be reproduced in whole or in part without the express consent of Drawing Capital Group, LLC (“Drawing Capital”). The information in this letter was prepared by Drawing Capital and is believed by the Drawing Capital to be reliable and has been obtained from sources believed to be reliable. Drawing Capital makes no representation as to the accuracy or completeness of such information. Opinions, estimates and projections in this letter constitute the current judgment of Drawing Capital and are subject to change without notice.