Introduction: The FANGMAN Companies
The “FANGMAN” acronym stands for 7 companies:
Facebook ($FB)
Amazon ($AMZN)
Netflix ($NFLX)
Google / Alphabet ($GOOGL and $GOOG)
Microsoft ($MSFT)
Apple ($AAPL)
NVIDIA ($NVDA)
Recently, the cumulative market valuations of these 7 companies exceeded the $10 trillion milestone. The size, scale, and scope of FANGMAN companies are enormous and continue to grow. In this newsletter, we explore the size, scale, and scope of FANGMAN companies through a series of charts and commentary. Importantly, all 7 of these companies share the following trait of being platform technology companies.
Historical Context and the Rise of Large Technology Companies
From a historical perspective, there is a big shift in the dominant companies over time.
In 1980, several of the biggest companies included the Sister 7 oil companies, auto companies, AT&T, GE, and IBM.
Fast forward 20 years to the year 2000, and “CIMQOS” was a common acronym to describe leading tech companies at the time, such as Cisco, Intel, Microsoft, Qualcomm, Oracle, and Sun Microsystems.
Fast forward another 20 years to today, and FANGMAN companies (Facebook, Amazon, Netflix, Google, Microsoft, Apple, and NVIDIA) account for nearly half of the QQQ ETF, which seeks to track the NASDAQ 100 Index.
Between the “CIMQOS” and “FANGMAN” acronyms, Microsoft is the only overlapping company.
Social media companies like Facebook, LinkedIn, and Twitter are more than just social networks. They are broadcast networks that are used by hundreds of millions of people on a daily basis.
For the top companies by market valuation, change is the only constant over time. The combination of creative destruction, rise and fall of specific industries and companies, technological progress, free cash flow generation capabilities, and the ability to better broadly serve larger customer bases are several of the key factors that influence the size of the top companies by market cap over time. The following chart from the Economic Research Council highlights the changing landscape for the top global companies by market cap from 1999-2019:
Inception to IPO and Beyond for FANGMAN Companies
5 notes to follow up the above chart:
FANGMAN companies were founded across 4 decades. Amazon was the quickest to IPO from its inception.
Sequoia Capital, a top-tier venture capital firm, successfully partnered with NVIDIA, Google, and Apple within the first 3 years of company formation and made very successful early-stage investments in these companies.
All 7 of these companies have global offices and are headquartered either in Silicon Valley or in the nearby Seattle area. The headquarters of Facebook, Google, Netflix, Apple, and NVIDIA are within a 21-mile driving distance.
Currently, only 3 of the 7 FANGMAN companies are led by the CEO who was also the company’s founders (“founder-led”). These 3 founder-led companies are Facebook (CEO is Mark Zuckerberg), Netflix (CEO is Reed Hastings), and NVIDIA (CEO is Jensen Huang).
Currently and with the exception of Facebook (~90%), more than 98% of the value of FANGMAN companies was created in the public markets. Said differently, less than 2% of the cumulative market caps of FANGMAN companies was created in the private markets, allowing for the average individual American investor to be a partial owner of these companies for several years and enjoy their value creation.
The Size, Scale, and Scope of Big Tech Companies
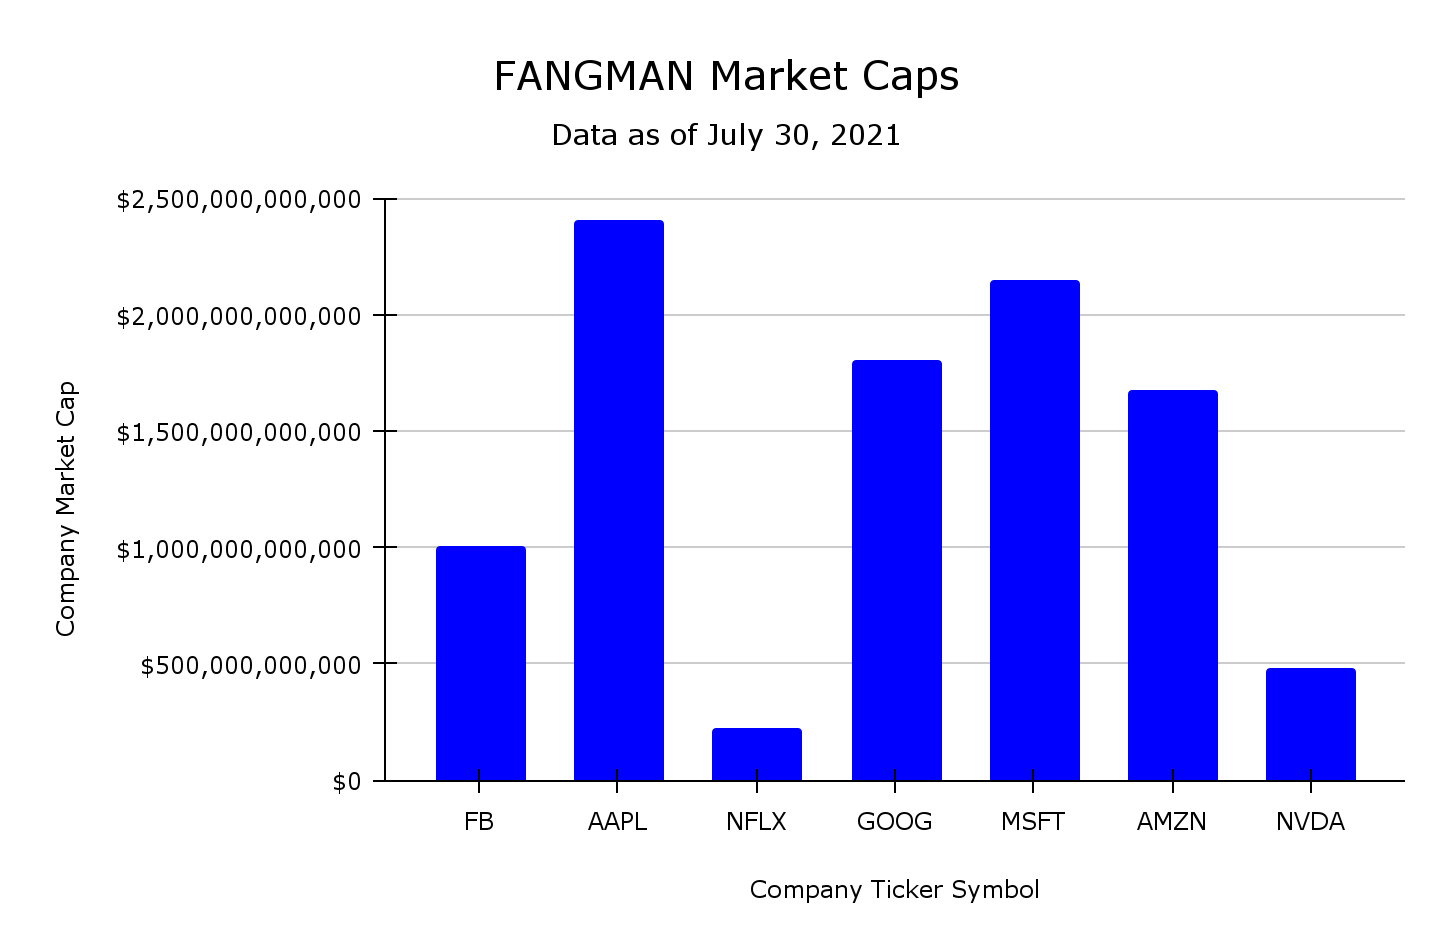
The size of the prize for Big Tech companies is significant, as seen by the fact that the cumulative market valuations of FANGMAN companies recently exceeded the $10 trillion milestone.
From 2013-2020, the cumulative market valuations of FANGMAN companies grew by more than 7x, which represents a nearly 28% compound annual growth rate (CAGR).
The following chart below highlights the percentage allocation of FANGMAN companies by market valuation:
Among the FANGMAN companies, Apple is currently the largest company by market cap, and Netflix is the smallest company by market cap. As of July 30, 2021, Apple’s market cap is about 11 times larger than Netflix’s market cap.
The 7 FANGMAN companies represent about half of the NASDAQ 100 Index and about one-quarter of the S&P 500 Index.
The following chart below displays the percentage allocation of the market caps of FANGMAN companies in SPDR’s S&P 500 Index Fund (ticker symbol: SPY).
The following illustration below from Russell Investments highlights the surprising fact that if Facebook, Apple, Amazon, Microsoft, and Alphabet were collectively removed from the Russell 1000 Index, then the performance of this index would actually be negative from 2015-2019. Therefore, Big Tech companies contribute a significant portion of the total return of the Russell 1000 Index.
Historical Stock Price Performance of FANGMAN Companies
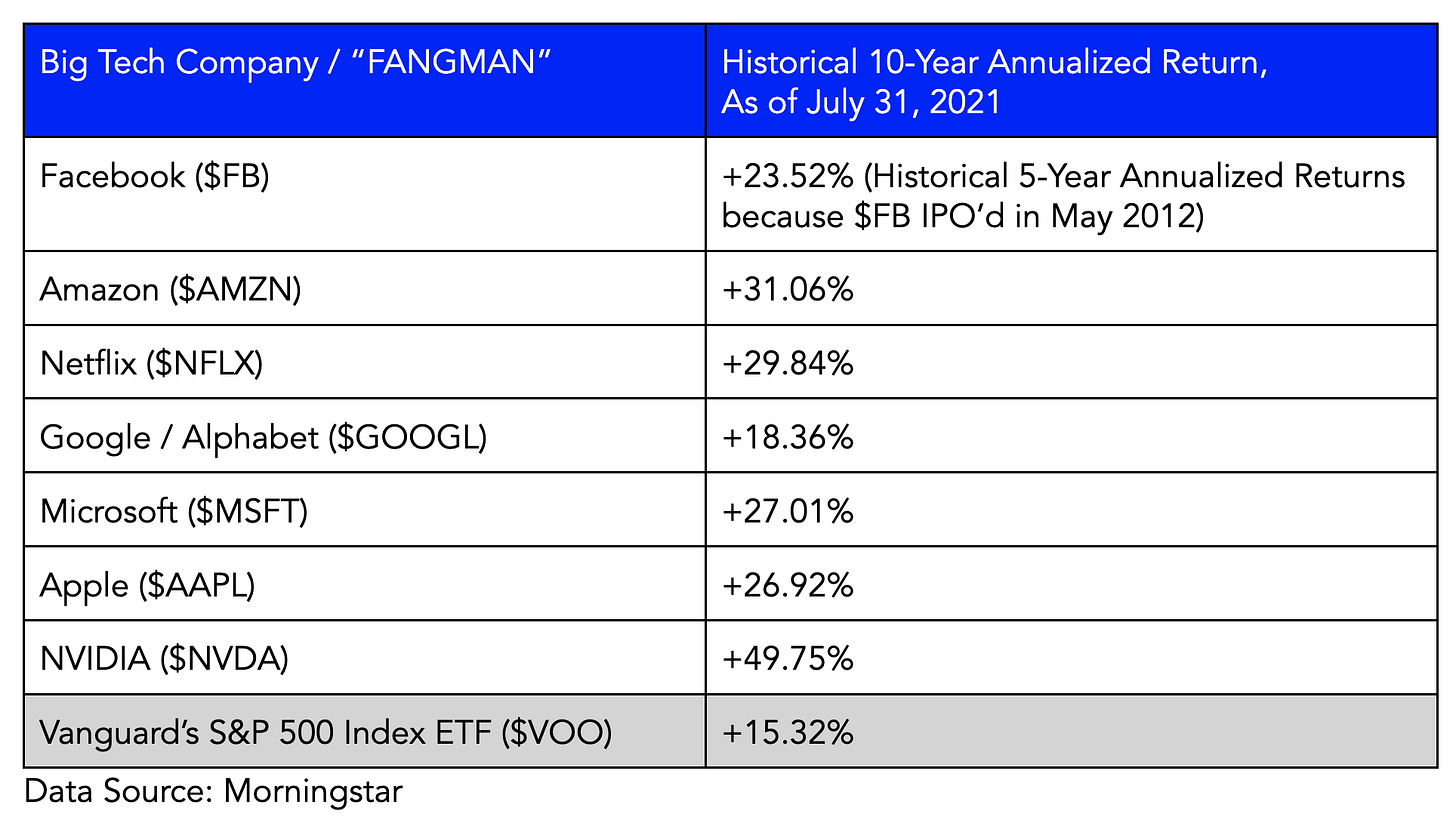
Let's take a look at historical “Big Tech” returns for the past 10 years as of July 31, 2021. Clearly, Big Tech companies, as represented by the 7 FANGMAN companies in the table below, have delivered significant returns to shareholders and stock-owning employees:
Over the past decade, NVIDIA’s stock ($NVDA) has been the best performing stock among the FANGMAN companies. Notably, all 7 of the FANGMAN companies have generated significantly positive returns that have also outperformed the return of the S&P 500 Index over the past decade.
Of course, investing carries risks and uncertainty, and future returns can differ from past performance. While it is true that the performance returns over the past several years for FANGMAN companies has been extraordinarily significant, it is also important to note that the trajectory of cumulative price performances have not been linear upward trajectories. Said differently, stock prices fluctuate, and FANGMAN companies have historically experienced a -10% or more severe drawdown in their stock prices from time to time. A drawdown measures the decline from the peak stock price to its lowest point over a time period before recovering, and some investors use drawdown as a measure of portfolio risk.
Business Moat with a Strong Competitive Edge:
3 steps to understand if a business has a moat with a competitive edge:
High competitive win rate and high customer retention. Advantaged business models allow a select group of companies to win a lot more on a persistent and recurring frequency over time. In the FANGMAN scenarios, each of these platform technology companies has a significant market share in the following categories:
Facebook: social networking, social media, and digital advertising
Amazon: e-commerce, retailing, and cloud infrastructure
Netflix: original content creation, streaming video content & entertainment
Google / Alphabet: information search, digital advertising, cloud infrastructure, video content, AI research, mobile app store, mapping technology, and more
Microsoft: workplace productivity software, cloud infrastructure, professional social networking, operating system, game consoles, and more
Apple: music streaming, wearable technology, profits earned in the smartphone industry, mobile app store, and more
NVIDIA: GPUs, data centers, AI chips & research
Pricing power translates the concept of “advantaged business model” in step 1 into actual revenue, gross margin dollars, and free cash flow. Good businesses have good pricing power that also advance technology forward on behalf of the consumer or enterprise customer. Companies in perfectly competitive industries have no pricing power, while companies that are monopolies or oligopolies have huge pricing power. Gross margins should be steady or ideally increasing over time.
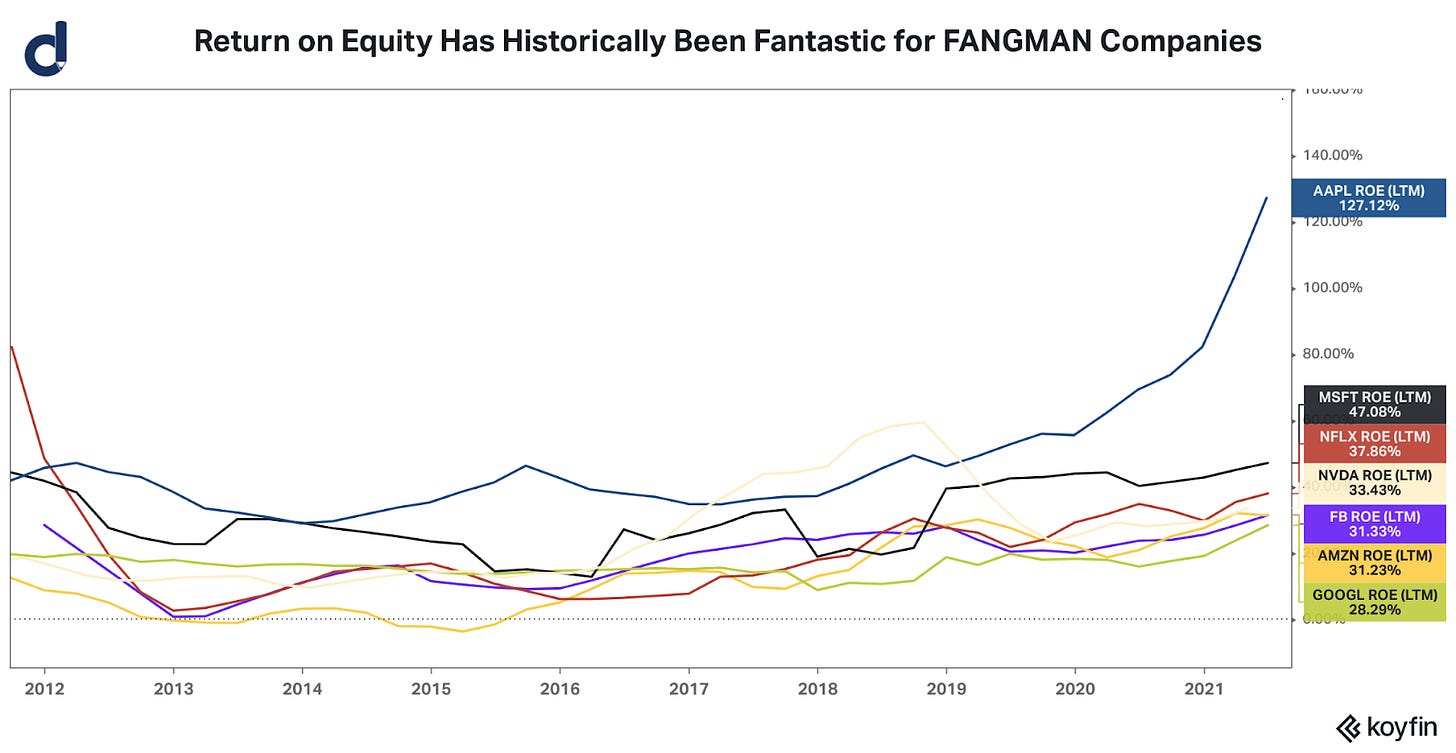
High returns on equity (ROE) and incremental invested capital (ROIIC) are financial performance measures. Great companies have solid returns on equity and know how to reinvest cash flows back into existing and new business units to pursue future growth opportunities, which enables positive compounding at scale over time. Companies that generate high and compounding returns at scale over time are lucrative for shareholders and stock-owning employees.
Concluding Thoughts
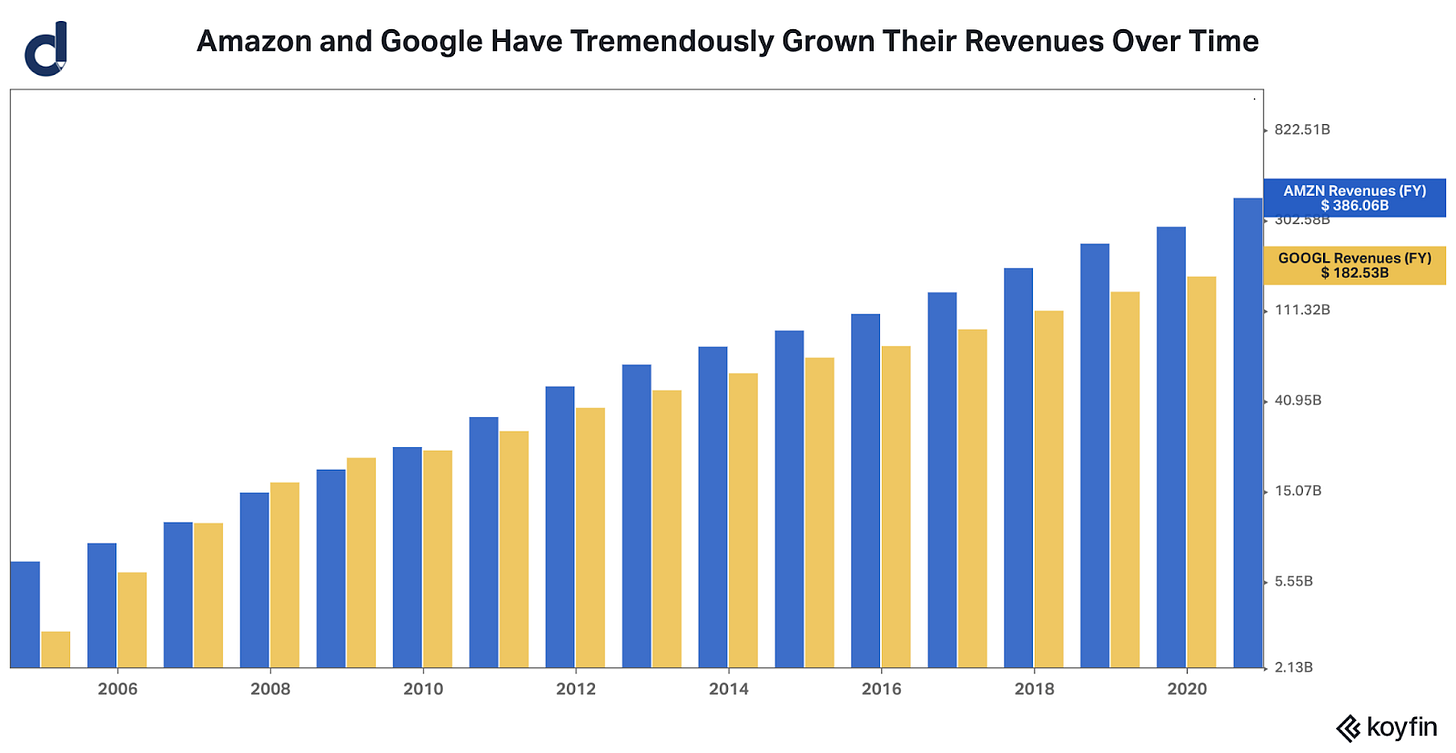
FANGMAN companies collectively reaching a combined $10 trillion in market cap represents a significant milestone and demonstrates the size, scale, and scope of Big Tech companies. In aggregate, FANGMAN companies continue to grow revenues, generate significant cash flows, maintain high returns on capital, and innovate at scale.
It is abundantly clear that software companies benefit from a significant secular tailwind. In aggregate, software companies continue to grow in revenue, business size, and in relative market share within the S&P 500.
We are of the opinion that Big Tech companies continue to be undervalued. While we believe that Big Tech companies will continue to face antitrust scrutiny and be political punching bags, the realities of Big Tech continue to be a humongous net positive for stakeholders by generating significant surplus to consumers, significant collective wealth for employees, significant collective wealth to homeowners located near Big Tech companies, significant corporate revenue growth and cash flows, and significant shareholder value.
The CEOs of Big Tech companies today control more economic resources than Presidents and Prime Ministers of several countries. Governments desire a monopoly of policy-making power and rule of law over their citizens. When companies threaten or disrupt this monopoly, they may be in the crosshairs of antitrust or other regulatory scrutiny from government regulators. A break-up of Big Tech companies may actually unlock more value to shareholders.
Internet scale businesses have been routinely under-estimated in the size of their total addressable markets (TAMs) by most investors. Internet scale businesses can expand their TAM across various sub-sectors and industries, continue to find specific niches to add value, and go nationwide and global in distribution.
References:
"Koyfin | Advanced graphing and analytical tools for investors." https://app.koyfin.com/. Accessed 1 Aug. 2021.
"Apple Inc (AAPL) Trailing Returns - XNAS | Morningstar." https://www.morningstar.com/stocks/xnas/aapl/trailing-returns. Accessed 1 Aug. 2021.
"SPDR® S&P 500 ETF Trust (SPY) Portfolio - ARCX | Morningstar." https://www.morningstar.com/etfs/arcx/spy/portfolio. Accessed 1 Aug. 2021.
"Portfolio Optimization - Portfolio Visualizer." https://www.portfoliovisualizer.com/optimize-portfolio. Accessed 2 Aug. 2021.
"Top Ten Companies by Market Cap over 20 Years – Economic ...." 1 Nov. 2019, https://ercouncil.org/2019/top-ten-companies-by-market-cap-over-20-years/. Accessed 1 Aug. 2021.
"Key Metrics - FactSet." 16 Jul. 2021, https://www.factset.com/hubfs/Website/Resources%20Section/Research%20Desk/Earnings%20Insight/EarningsInsight_071621.pdf. Accessed 1 Aug. 2021.
"Could the tech bubble burst again? How today's market stacks up ...." 8 Jan. 2020, https://russellinvestments.com/us/blog/could-the-tech-bubble-burst-again-how-todays-market-stacks-up-against-the-90s. Accessed 1 Aug. 2021.
This letter is not an offer to sell securities of any investment fund or a solicitation of offers to buy any such securities. An investment in any strategy, including the strategy described herein, involves a high degree of risk. Past performance of these strategies is not necessarily indicative of future results. There is the possibility of loss and all investment involves risk including the loss of principal.
Any projections, forecasts and estimates contained in this document are necessarily speculative in nature and are based upon certain assumptions. In addition, matters they describe are subject to known (and unknown) risks, uncertainties and other unpredictable factors, many of which are beyond Drawing Capital’s control. No representations or warranties are made as to the accuracy of such forward-looking statements. It can be expected that some or all of such forward-looking assumptions will not materialize or will vary significantly from actual results. Drawing Capital has no obligation to update, modify or amend this letter or to otherwise notify a reader thereof in the event that any matter stated herein, or any opinion, projection, forecast or estimate set forth herein, changes or subsequently becomes inaccurate.
This letter may not be reproduced in whole or in part without the express consent of Drawing Capital Group, LLC (“Drawing Capital”). The information in this letter was prepared by Drawing Capital and is believed by the Drawing Capital to be reliable and has been obtained from sources believed to be reliable. Drawing Capital makes no representation as to the accuracy or completeness of such information. Opinions, estimates and projections in this letter constitute the current judgment of Drawing Capital and are subject to change without notice.


