


Getting the Investing Odds in Your Favor by Understanding Market Structure
Weekly updates on the innovation economy.

Introduction
Financial markets exist for the efficient formation of capital to help build and grow businesses and to allocate and price risk. Investing involves an understanding of knowing the distributions of probabilities of various outcomes and the magnitude of those outcomes. Notably, understanding market structure, historical outcomes, and a changing investing landscape can help more investors get the odds of investing success in their favor.
The following topics will be discussed in today’s newsletter:
3 Types of Financial Squeezes
Evolutions of Market Structure and its Impacts to Investors
Money Supply and Number of Shares Outstanding
Rolling Index Returns
Historical Probabilities of S&P 500 Index Returns
3 Types of Financial Squeezes
Before diving deeper, it is important to understand a few basics. In the context of financial markets, a “squeeze” typically refers to dramatic changes in a company’s stock price that forces investors to make material changes to their position that wouldn’t otherwise be necessary. In making these changes, a continuous ripple effect can be felt across asset prices that are both directly and indirectly involved. Simply stated, a “squeeze” involves a significant imbalance between supply and demand, causing sudden price changes. For purposes today, this squeezing involves forcing the price of the stock higher, of which there are three prevalent types of financial squeezes:
Short Squeeze - A rising stock price forces short sellers (investors betting that a stock price will decline) to buy back shares that were previously sold, contributing to a further increase in the stock’s share price, forcing more short sellers to cover.
Gamma Squeeze - A high volume demand in buying call options causes investors or market makers that wrote/sold the call options to the call option buyer to buy shares in the stock in order to hedge the short call option position. As a call option becomes more “in the money”, its option delta typically increases, thereby forcing the investor with the short call option position to buy more shares to maintain a delta-neutral portfolio. Notably, option contracts are leveraged instruments.
Social Squeeze - A significant and rising demand in buying specific stocks and call options by a collective group of individuals or institutional investment funds creates a significant price increase in the underlying stock, often in conjunction with a short squeeze and/or gamma squeeze. Among individuals, social online forums and websites, such as Reddit’s “WallStreetBets” and “SPACs” forums, are popular among millions of people in understanding investor sentiment, sharing trading ideas, and generating network effects.
The combination of high short interest, a short squeeze, a gamma squeeze, and a social squeeze can create a significant supply-demand imbalance that causes a significant price change in a stock. As a result, short selling can have significant investment risks.
Evolutions in Market Structure and the Rise of Index Funds Influencing Stock Prices
At a high level, evolutions in market structure impact security prices and potentially improve transparency, liquidity, and efficiency of financial markets over time. At an investor-specific level, evolutions in market structure have impacted market prices and influences behavioral sentiment among investors.
Research from JP Morgan indicates these 3 notable traits:
Less than 20% of trading volume in stocks occurs from fundamental discretionary traders, implying that the majority of stock market investors do not make “buy or sell” decisions based on stock-specific fundamentals.
The vast majority of stock market trading is executed by algorithmic trading.
As of December 2020, JPMorgan estimated that about 90% of the S&P 500 market cap is based on its intangible assets, not the tangible book value. For comparison, only 30% of the S&P 500 market cap was based on intangible assets in 1985.
Why are these important to investors?
50 years ago, it was relatively straightforward to use price-to-book ratio and discounted cash flow analysis to understand if a company is undervalued or overvalued because the vast majority of a company's value was based on its future cash flows and tangible book value (assets and liabilities on the balance sheet). Because the vast majority of the value today is based on future technology, future operating cash flows, and intangible assets, changing investor perceptions/behaviors about the value of intangible assets and about the future impact market prices today.
Index funds do not do fundamental analysis nor price discovery when making trading decisions because they follow the creation/redemption process based on investor flows and follow pre-set rebalancing formulas and allocations based on the creator of an index. Also, these passive index fund owners typically are long-term investors of securities and therefore can be counted out of the numeric float of shares that is available for trading.
The majority of trading activity today is based on market making, ETF creation/redemption process, index arbitrage, statistical arbitrage, and liquidity fulfillment.
There are less investors doing fundamental research and price discovery, but at the same time, these investors are more informed than ever before, especially with high access to diverse sources of information. Therefore, investors with differentiated and sophisticated viewpoints on a specific industry may be able to generate significant value.
Rapid and forced selling (usually the selling of leading portfolio positions) in turn contributes to price volatility in stocks that the average investor might hold. This volatility may further influence investor behavior in the short-term, spanning across equity markets.

Index inclusion decisions by index creators impact stock prices. When companies get included into a popular index (such as the S&P 500 or Russell 2000), the stock prices of these companies have a tendency to rapidly increase. Conversely, when companies are removed from a popular index, index funds become forced sellers of the stocks of these companies, which puts a downward pressure on these stocks even though the company has not fundamentally changed from a business perspective.
A virtuous cycle occurs in which companies enjoy a continued flow of investment when they are included in popular indices since more money is being invested through index funds, which thereby drives up the prices of stocks that are included in the index, which thereby helps to outperform other securities and actively managed funds that do not invest in the same basket of securities as the index. On the opposite side of a virtuous cycle is a vicious cycle, in which stocks that are excluded from popular indices do not enjoy the positive feedback loops of included stocks.
A positive feedback loop exists for companies that experience high fund flows and/or are included in popular index funds. High fund flows can increase a company’s stock price, and then a company can use its high stock price as a competitive advantage compared to other companies by using its high stock price to:
Recruit and retain talented employees with appreciating stock
Use its shares as currency for stock-based acquisitions
Use its increased market cap for more brand exposure and awareness, which promotes higher future margins with a declining cost curve for marketing expenses as a percentage of revenue
Many institutional pools of capital, 401k accounts, pension plans, RIAs, and financial advisors/wealth advisors are increasingly allocating more money into index funds, which contributes to the rise of index investing and the rise of more investment dollars being allocated to the S&P 500 Index, which thereby automatically allocates a significant percentage of every marginal dollar invested in an S&P 500 index fund into the stocks of large companies, such as Apple, Alphabet, Amazon, Facebook, Microsoft, Tesla, Visa, Berkshire Hathaway, and JPMorgan & Chase.
Money Supply, Interest Rates, and Shares Outstanding
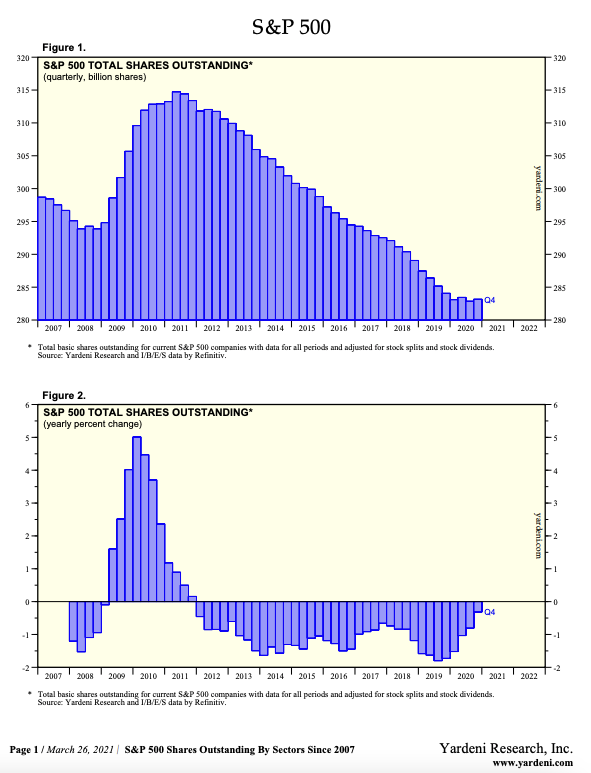
The total number of S&P 500 shares have dropped from the local peak in 2011. Stock buybacks are a key source for reducing the number of shares outstanding.

Dividends and share buybacks represent 2 methods of distributing excess cash flow and excess cash on the balance sheet to shareholders. While both dividends and share buybacks appear to be economically cyclical in aggregate for S&P 500 companies, share buybacks have greater volatility in their cyclicality. Meanwhile, compared to a share buyback (which have benefits in tax efficiency and flexibility), a cash dividend is a cash payment that an individual investor “actually sees” via money coming into a brokerage account.
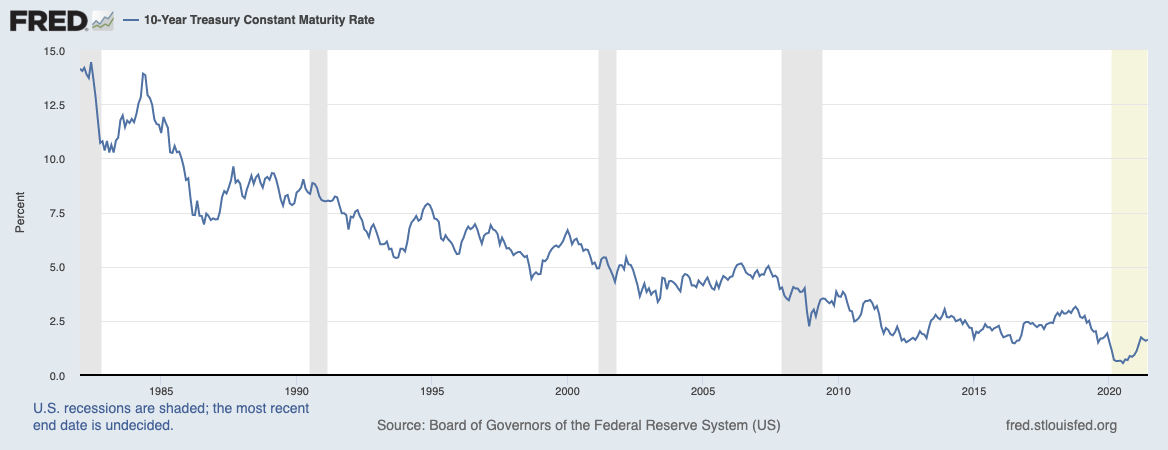
The 10-Year Treasury yield has experienced a downward trend since 1982. Lower Treasury yields imply that the US federal government pays a lower interest rate to borrow money.

Due to the Federal Reserve’s unprecedented monetary policy to economically combat the consequences from the coronavirus crisis, M2 money supply increased from $15.3 trillion in December 2019 to $20.1 trillion in May 2021.

Since 2012, the S&P 500 has enjoyed an upward climb. Even during periods of steep selloffs in the S&P 500 over the past decade (such as in August 2015, Q1 2016, Q1 2018, Q4 2018, Q1 2020), the steep selloffs recovered via a V-shaped recovery. Notably, the S&P 500 index at its current price is significantly above its price level before the coronavirus crisis.
The culmination of these charts from the Federal Reserve and Yardeni Research yield a fascinating conclusion, in which the combination of the following factors lead to a natural appreciation in the nominal price of the S&P 500 Index in the long run:
Rising money supply, which represents a higher volume of capital seeking a return
Declining supply in the number of shares outstanding in the S&P 500 index, which lead to constrained supply
Declining interest rates and increasing monetary debasement via central bank stimulus for the past 20 years, which influences higher investor allocations into stocks, real estate, private investment vehicles, and alternative assets
America’s growing economy, which allows companies in aggregate to grow their revenues as the economic pie grows over time in the long run.
Said differently, basic economic knowledge indicates that when there is higher demand and constrained supply, prices inevitably rise over time. Notably, the monetary policy cycle is a leading indicator of the stock market cycle, which is a leading indicator of the economic cycle.
Rolling Returns
The “historical occurrences and return outcomes” in the following charts below demonstrate that longer holding periods are typically associated with better investment returns for these indices. The phrase, “blindly buying”, in the following charts refers to an investor randomly “buying” an index on any trading day at its closing price. In addition, by incorporating the “blindly buying” component to the analysis, it somewhat removes the timing element of buying and selling index funds, which supports a known phrase in the investment community: “time in the market often outperforms timing the market”.
A quick note: when this article refers to “buying the index”, this is a theoretical proposition. In reality, it is typically not possible to actually “buy the index”, and investors seek to track the performance of an index through buying a high-quality index fund. Traits that help determine if an index fund is of high quality include:
Low tracking error relative to an underlying benchmark index
Low expense ratios and fees
High liquidity and volume
High reputation and quality of index fund provider
Since an index itself cannot be bought, here’s a sample list of ETFs that track the 4 indices mentioned below:


Evaluating the above 3 charts results in at least 3 key findings:
1-year index returns have greater variance compared to 10-year returns.
Historically, being a long-term investor in major stock indices such as the S&P 500 and NASDAQ 100 increased the likelihood of achieving positive returns.
Due to the tech bubble, the NASDAQ 100 Index generated significant performance compared to other major market indices in the late 1990s.

Key takeaways:
Buying the S&P 500 Index at the closing price of any trading day between 1988-2019 and holding this investment for 1 year would have produced a positive return about 80% of the time.
Staying invested in the long term leads to a high probability of generating positive returns. As seen in the above chart, buying the S&P 500 Index at the closing price of any trading day between 1988-2011 and holding this investment for 10 years would have produced a positive return about 89% of the time.
It is typically easier to compound returns over long time periods compared to very short durations. Positive compounding of returns is advantageous to investors. As seen in the above chart, buying the S&P 500 Index at the closing price of any trading day between 1988-2011 and holding this investment for 10 years would have produced a greater than 50% cumulative return about 79% of the time.
Conclusion
Many very successful long-term investors care deeply about 2 traits: avoidance of permanent long-term capital loss and finding businesses that compound at high and growing rates of return. While short-term investors are typically price-sensitive (and therefore are often focused on price multiples, sentiment, and the Federal Reserve’s monetary policy which impacts interest rates), long-term investors desire growing cash flows from a business over time, which thereby increases a company’s intrinsic value and stock price. By evaluating the historical data for the NASDAQ 100 Index (index ticker: NDX), S&P 500 Index (index ticker: SPX), Dow Jones Industrial Average (index ticker: INDU), and the Russell 2000 Index (index ticker: RTY), it is clear that a longer holding period for index funds tracking these indices on average reduces the probability of permanent capital loss and simultaneously provides the opportunity to grow an investment’s value over time.
In conclusion, understanding market structure, historical outcomes, and a changing investing landscape can help more investors get the odds of investing success in their favor to improve investor outcomes.

References:
"Just 10% of trading is regular stock picking, JPMorgan estimates." 13 Jun. 2017, https://www.cnbc.com/2017/06/13/death-of-the-human-investor-just-10-percent-of-trading-is-regular-stock-picking-jpmorgan-estimates.html. Accessed 4 Jun. 2021.
"Sell-offs could be down to machines that control 80% of US stocks ...." 5 Dec. 2018, https://www.cnbc.com/2018/12/05/sell-offs-could-be-down-to-machines-that-control-80percent-of-us-stocks-fund-manager-says.html. Accessed 4 Jun. 2021.
"S&P 500 Shares Outstanding By Sectors Since ... - Yardeni Research." 26 Mar. 2021, https://www.yardeni.com/pub/sharesos.pdf. Accessed 4 Jun. 2021.
"S&P 500 (SP500) | FRED | St. Louis Fed." https://fred.stlouisfed.org/series/SP500. Accessed 4 Jun. 2021.
"M2 Money Stock (M2SL) | FRED | St. Louis ...." https://fred.stlouisfed.org/series/M2SL. Accessed 4 Jun. 2021.
"10-Year Treasury Constant Maturity Rate ...." https://fred.stlouisfed.org/series/DGS10. Accessed 4 Jun. 2021.
"Koyfin." https://app.koyfin.com/. Accessed 4 Jun. 2021.
This letter is not an offer to sell securities of any investment fund or a solicitation of offers to buy any such securities. An investment in any strategy, including the strategy described herein, involves a high degree of risk. Past performance of these strategies is not necessarily indicative of future results. There is the possibility of loss and all investment involves risk including the loss of principal.
Any projections, forecasts and estimates contained in this document are necessarily speculative in nature and are based upon certain assumptions. In addition, matters they describe are subject to known (and unknown) risks, uncertainties and other unpredictable factors, many of which are beyond Drawing Capital’s control. No representations or warranties are made as to the accuracy of such forward-looking statements. It can be expected that some or all of such forward-looking assumptions will not materialize or will vary significantly from actual results. Drawing Capital has no obligation to update, modify or amend this letter or to otherwise notify a reader thereof in the event that any matter stated herein, or any opinion, projection, forecast or estimate set forth herein, changes or subsequently becomes inaccurate.
This letter may not be reproduced in whole or in part without the express consent of Drawing Capital Group, LLC (“Drawing Capital”). The information in this letter was prepared by Drawing Capital and is believed by the Drawing Capital to be reliable and has been obtained from sources believed to be reliable. Drawing Capital makes no representation as to the accuracy or completeness of such information. Opinions, estimates and projections in this letter constitute the current judgment of Drawing Capital and are subject to change without notice.