Introduction
In this week’s newsletter, we focus on exploring the recent market volatility with “Growth-Quake”, S&P 500 Index drawdowns, volatility products, and key insights about volatility.
Volatility is a key attribute to consider when making investment decisions because historical volatility patterns assist with providing a framework for the possible risk profile associated with an investment. The CBOE VIX Index (“VIX”) is a popular measure of volatility for the S&P 500 Index. For the curious investor, VOLQ is a volatility measure for the NASDAQ 100 Index, and the MOVE Index is a measure of volatility in the US Treasury bond market.
“Growth-Quake”
Drawing Capital has named the recent market sell-off in the past 3 weeks as "Growth-Quake": an earthquake that momentarily shook the high stock price trajectories of innovative, technology-enabled, and high-growth companies. From our perspective, here are a few thoughts about the current “Growth-Quake”:
This sell-off in high-growth companies and tech stocks (often with high price multiples) seems to be driven by 2 reasons: rising long-term interest rates and unwinding of the 2020 price surge (significant price multiple expansion) in several tech companies that experienced a one-time accelerated growth from the pandemic. Nonetheless, several software and semiconductor companies forecast projections sustaining accelerating revenue growth going forward, so this is a pick-and-choose-carefully investing environment.
Rising long-term interest rates cause a decline in the value of long-duration assets, which can be defined as assets that have both little short-term cash flows today and potential for generating continued large cash flows many years from now. Examples of long-duration assets include long-term bonds, high-growth companies that are currently reinvesting operating cash flows into new products and growth opportunities, and many technology and biotech companies that are valued on future innovation, R&D, business segment moat & market share, and product development. Previously, when the 10-year Treasury yield was near 0.5%, that's a bond P/E multiple of 200, which means that equities were undervalued in mid-2020 relative to bonds, so more investors piled into stocks after the Feb-March 2020 market crash. As the 10-year Treasury yield approaches 2% (still a low yield), that's a pseudo-equivalent to a bond P/E multiple of 50, but notice how that's a big drop in P/E from 200 to 50. Therefore, fewer investors are willing to pay 50x or higher in terms of price/revenue ratio or price/earnings ratio when investing in stocks.
Often, there are 2 causes for a rise in interest rates: higher anticipated future inflation rates in consumer prices (not great) or high anticipated economic recovery and growth (this is great for the economy).
Several SPACs sold off significantly in price this past 2 weeks. In some ways, SPACs may be thought of as “pseudo-synthetic” convertible bonds in that:
SPACs have a redemption feature for shares, typically at $10 per share, in the event that the SPAC shareholder does not wish to be a shareholder of the private company being taken public. Therefore, there is a partial downside floor for SPAC shareholders before a target company is officially taken public via the SPAC process.
SPAC shareholders that like the private company being taken public have their shares convert into ownership of the target company.
SPACs benefit from expansionary monetary policy because, in a zero or negative interest rate environment, people would rather invest incremental dollars into a SPAC that has a probability of appreciating in value or remaining constant compared to a bond that pays zero or negative interest rates.
As long as interest rates remain relatively low, there continues to exist a TINA (“There Is No Alternative”) effect (there is no alternative for earning reasonably high yields other than buying stocks, real estate, bitcoin, scarce assets, and a select few other things). High-growth, high-quality companies continue to command premium prices, especially since there is a scarcity of these types of companies in public markets. We are of the view that it makes sense to remain optimistic on innovative companies that focus on exponential growth (not linear growth) that have the opportunity to be in the "winner take most" cohort within a business segment.
The monetary policy cycle (Fed balance sheet expansion, quantitative easing, low-interest-rate environment, etc.) is a leading indicator for the stock market, which is a leading indicator of the economy.
Managing large drawdowns is the price for investing in innovation because innovative companies share 3 key traits: uncertainty about if the innovation will occur and be adopted in the future, high price multiples, and sensitivity to long-term interest rates because innovation-focused investments are long-duration assets.
As of December 2020, JPMorgan estimated that about 90% of the value of the S&P 500 Index is based on its intangible assets, not the tangible book value. Why is this important? This is significant because 50 years ago, it was relatively straightforward to use price-to-book value to understand if a company is undervalued or overvalued because the vast majority of a company's value was based on its tangible book value (assets and liabilities on the balance sheet). Because the vast majority of the value today is based on future value and intangible assets, changing investor perceptions/behaviors about the value of intangible assets and about the future impact market prices today.
VIX Charts and Intra-Year S&P 500 Declines
Key insights and ideas about equity market volatility are described in the following four charts below:
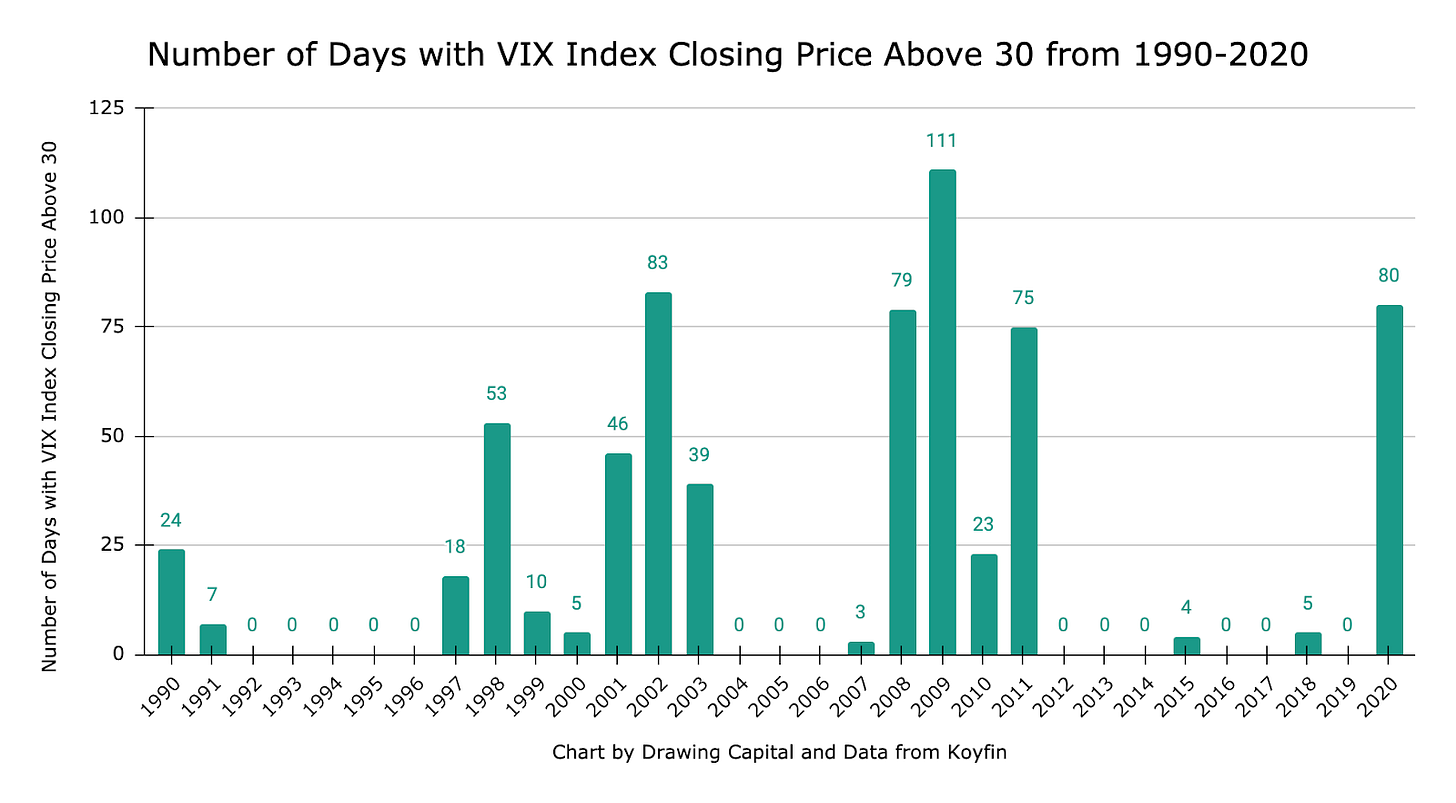
Volatility spikes during periods of high financial stress, deep uncertainty, and lack of clarity in equity markets and the economy.
From 1990-2020, there was about 10 times the number of days where the VIX closing price was above 30 compared to the number of days where the VIX closing price was below 10. Intuitively, investors like upside volatility and dislike downside volatility.
There exists a clustering effect regarding the number of days where the closing price of the VIX Index is above 30. Logically, this is rational. There was high uncertainty and volatility during the following events:
America’s economic recession in 1990
Asian financial crisis in 1997-1998
The combination of the bursting of the dot com bubble and the 9/11 terrorist attacks in 2000-2003
The global financial crisis and housing collapse in 2007-2009
Debt deliberations and crisis in 2011
The coronavirus crisis in 2020
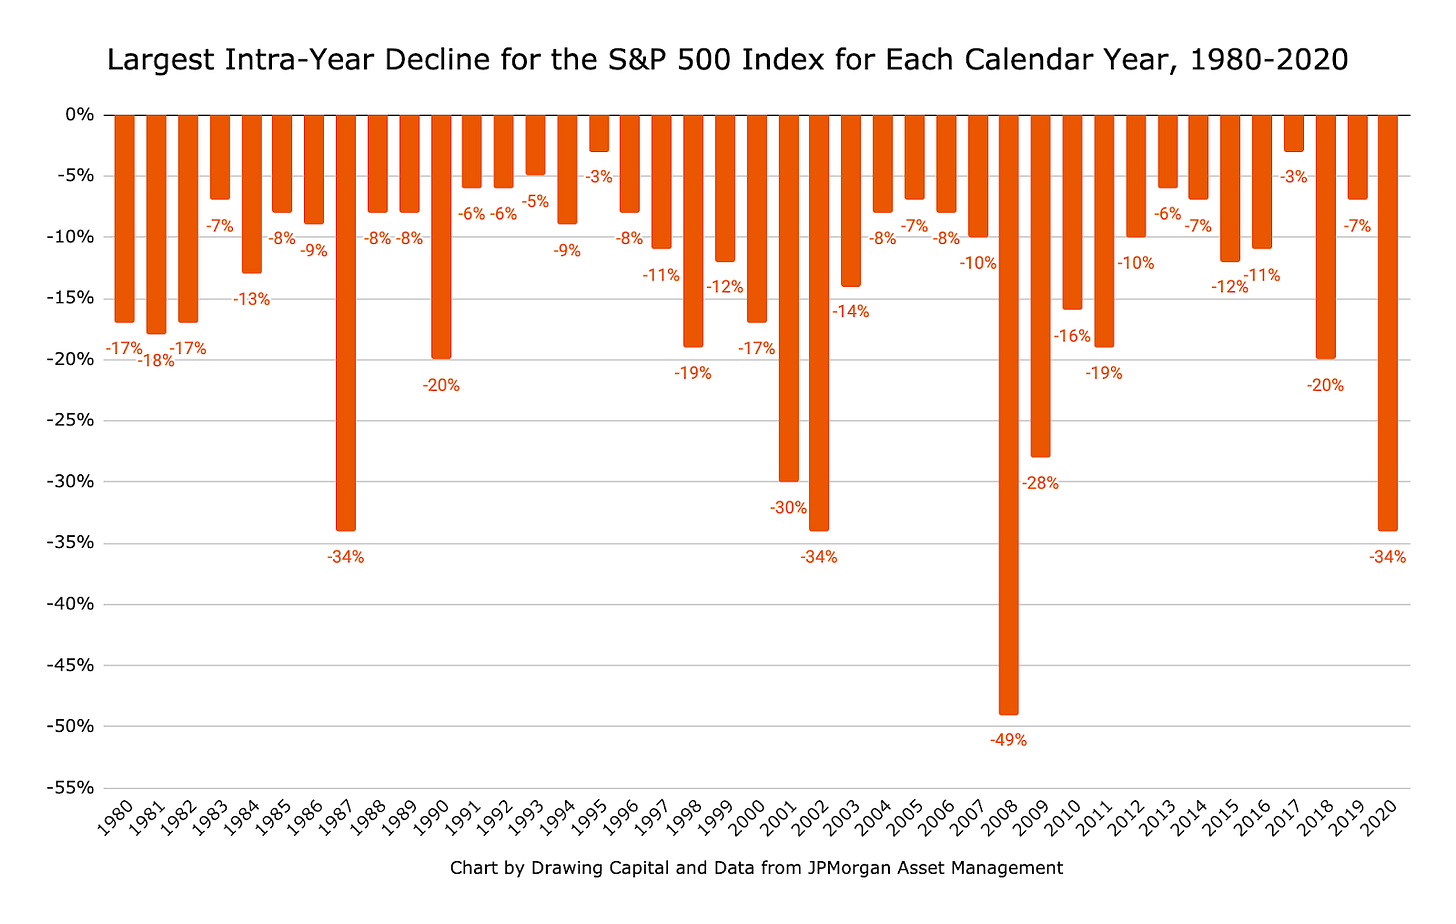
This chart demonstrates that despite a historically-positive-trending S&P 500 in the long run, intra-year declines that exceed 10% in a year were quite common between 1980-2020. Logically, the steepest intra-year drawdowns tend to occur during periods of high financial market uncertainty and economic recessions.
Short Volatility and Long Volatility Indices
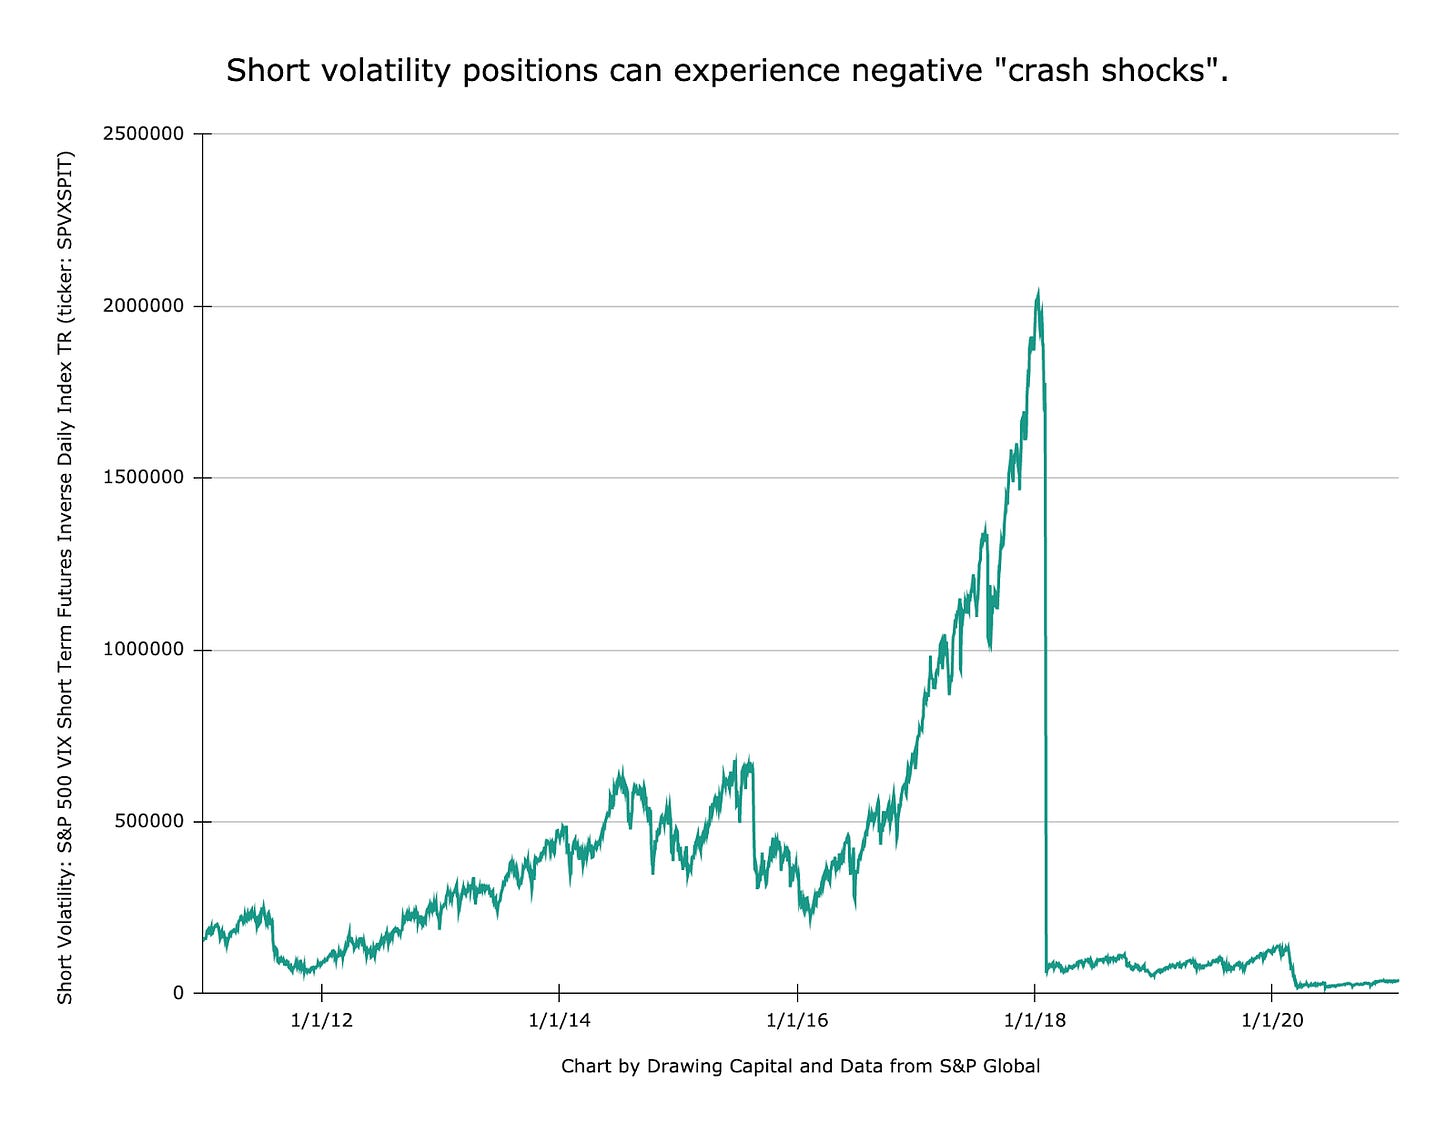
Maintaining a “short volatility position” is a positive carry trade and can be particularly lucrative if the large negative crash shocks are avoided. However, without proper marketing timing, avoidance of these negative crash shocks is often difficult.
Starting the 2020 year with a “short volatility position” would have generated significant losses, especially due to the coronavirus crisis and its effects on health, the economy, and financial markets.
A key concern about holding a “long volatility position” for several years is that over the past 9 years, a “long volatility position” had negative compounding returns, which may have caused steep losses to some investors. As a result, investors perhaps may be better off having a short-term “long volatility position” with good timing compared to maintaining a long-term “long volatility position” as a long-term hedge in a portfolio.
In 2020, starting the year with a “long volatility position” and holding it until the end of March 2020 would have been very profitable. With unprecedented monetary and fiscal stimulus in America, financial market volatility began to decline between April 2020 and the end of the 2020 year, with some upward spikes during the last 3 quarters in 2020 due to concerns about the coronavirus treatment efficacies, coronavirus vaccine distributions, 2020 presidential election, and other events in 2020.
Margaret Sundberg’s Volatility Research
In Margaret Sundberg’s research paper titled “Challenges of Indexation in S&P 500 Index Volatility Investment Strategies” in July 2019, she highlights a number of interesting analyses regarding volatility (3):
There has historically been a positive drift in US equity index returns in the long term, implying that US equity indices historically had a tendency to rise in the long term.
Data from Sundberg’s research suggests that asymmetry of options returns increases in 2 scenarios: as options approach the expiration date, and as options become more out-of-the-money in terms of the strike price.
The asymmetry of options implies an inverse correlation between the probability of a successful option payoff and the magnitude of the potential payoff in terms of percentage returns.
Both short volatility and long volatility strategies are tough to manage. Short volatility strategies are notorious for providing consistent cash flow followed by catastrophic blow-ups, while long volatility strategies typically lose value through negative compounding over the long term. The opportunity from having a positive-carry volatility position (such as selling puts or calls on VIX or VXX) typically leads to adverse negative surprises, while the opportunity to participate in positive surprises (aka long volatility) typically comes with a negative carrying cost.
Additional Insights
S&P 500 Index Returns are fat-tailed and not normally distributed. There exists a clustering of returns and a clustering of volatile periods, indicating that investor behavior in financial markets shifts between a pendulum of fear (fear of losing money) and greed (fear of missing out on positive returns).
Investors with an optimistic market position fear downside volatility and appreciate upside volatility.
There are various methods of gaining exposure to volatility for a “long volatility position” or a “short volatility position”. Popular methods of gaining exposure to volatility include specific ETNs like the VXX Fund and derivative contracts on volatility indices.
There is a positive correlation between the largest intra-year decline in a calendar year of the S&P 500 and the number of days the VIX Index closed above 30 in a calendar year.
Investors prefer certainty over randomness. When outcomes are certain, there is often a commensurate low return for investing in a certain outcome. A great example of this concept is the return of a FDIC-insured CD. On the other hand, investments with a low degree of certainty often can have both an elevated probability of loss and a wider distribution of outcomes, potentially leading towards a higher asymmetric upside opportunity. In the absence of certainty, there are deviations in sentiment and valuation frameworks among market participants, which leads to higher volatility. In periods of higher volatility, the VIX Index spikes upward, which often coincides with a decrease in market index prices.
There is column clustering in the column chart that displays the number of days the VIX Index closes above 30 in a calendar year.
In every calendar year for the S&P 500 Index for the past 30 years, there have been intra-year declines, regardless of the actual positive or negative calendar year return for the S&P 500 Index.
Volatility exists in equity markets, even in positive performance years.
A common characteristic in building sophisticated portfolios is pooling together a portfolio of assets that have uncorrelated returns with future potential appreciation in value. As investors increasingly amplify their risk profile in search of returns in a low-interest-rate environment that is supported globally by central banks, it is increasingly important to evaluate both the appreciation potential and its correlation risk attribution when deciding on adding investments to an existing portfolio.
Especially in periods of market stress and volatility, stay true to important investing principles: follow a financial plan, understand a distribution of outcomes, rebalance portfolios to find opportunities and align one’s portfolio with an investment strategy, and know what you own and why you own it.
References:
(1) "S&P 500 VIX Short-Term Futures Index - S&P Dow Jones ...." https://www.spglobal.com/spdji/en/indices/strategy/sp-500-vix-short-term-index-mcap/. Accessed 25 Jan. 2021.
(2) "S&P 500 VIX Short Term Futures Inverse Daily Index - S&P ...." https://www.spglobal.com/spdji/en/indices/strategy/sp-500-vix-short-term-futures-inverse-daily-index/. Accessed 25 Jan. 2021.
(3) "Challenges of Indexation in S&P 500 Index Volatility ...." 30 Jul. 2019, https://papers.ssrn.com/sol3/papers.cfm?abstract_id=3427350. Accessed 25 Jan. 2021.
(4) Guide to the Markets | J.P. Morgan Asset Management." https://am.jpmorgan.com/us/en/asset-management/adv/insights/market-insights/guide-to-the-markets/. Accessed 25 Jan. 2021.
This letter is not an offer to sell securities of any investment fund or a solicitation of offers to buy any such securities. An investment in any strategy, including the strategy described herein, involves a high degree of risk. Past performance of these strategies is not necessarily indicative of future results. There is the possibility of loss and all investment involves risk including the loss of principal.
Any projections, forecasts and estimates contained in this document are necessarily speculative in nature and are based upon certain assumptions. In addition, matters they describe are subject to known (and unknown) risks, uncertainties and other unpredictable factors, many of which are beyond Drawing Capital’s control. No representations or warranties are made as to the accuracy of such forward-looking statements. It can be expected that some or all of such forward-looking assumptions will not materialize or will vary significantly from actual results. Drawing Capital has no obligation to update, modify or amend this letter or to otherwise notify a reader thereof in the event that any matter stated herein, or any opinion, projection, forecast or estimate set forth herein, changes or subsequently becomes inaccurate.
This letter may not be reproduced in whole or in part without the express consent of Drawing Capital Group, LLC (“Drawing Capital”). The information in this letter was prepared by Drawing Capital and is believed by the Drawing Capital to be reliable and has been obtained from sources believed to be reliable. Drawing Capital makes no representation as to the accuracy or completeness of such information. Opinions, estimates and projections in this letter constitute the current judgment of Drawing Capital and are subject to change without notice.


