Historical Consistency in Long Term Index Returns
Weekly updates on the innovation economy and market commentary.
Today’s newsletter focuses on the importance of long-term consistency in investment returns in an effort to generate favorable long-term wealth creation from investments.
The Power of Compounding Returns
Key Insights:
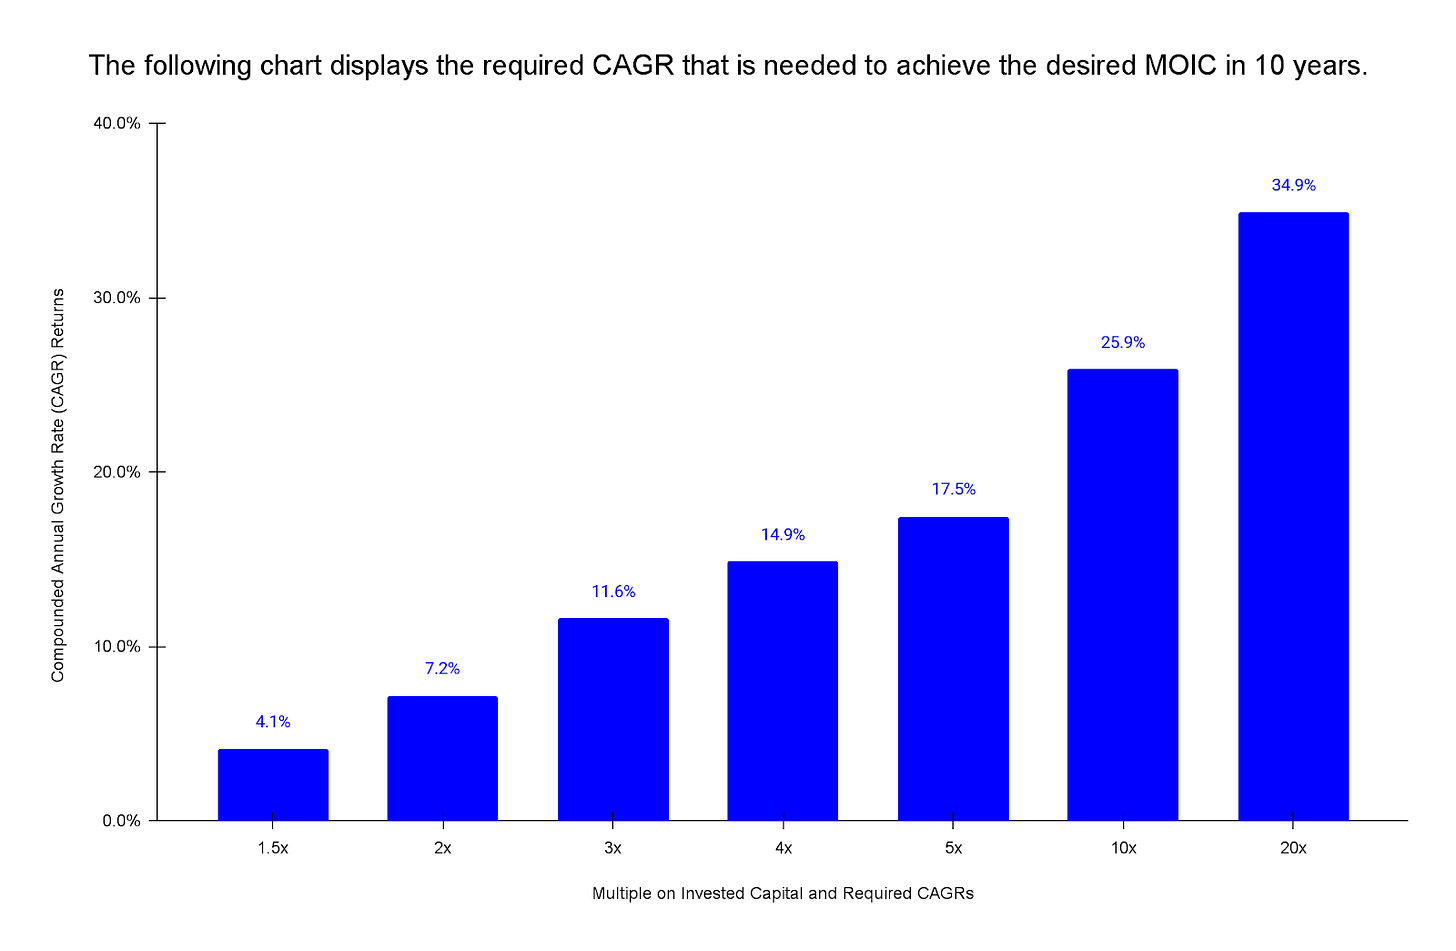
There is a positive relationship between higher CAGR and higher MOIC.
CAGR = compounded annual growth rate. MOIC = multiple on invested capital.
From a “working backwards” perspective by first identifying the goal and then creating a roadmap to achieving the goal, if an investor desires a 10x investment return in 10 years, this goal implies a nearly 26% CAGR. Meanwhile, a 2x investment return (ie, doubling of the initial investment) implies a necessity to earn a nearly 7.2% CAGR over 10 years.
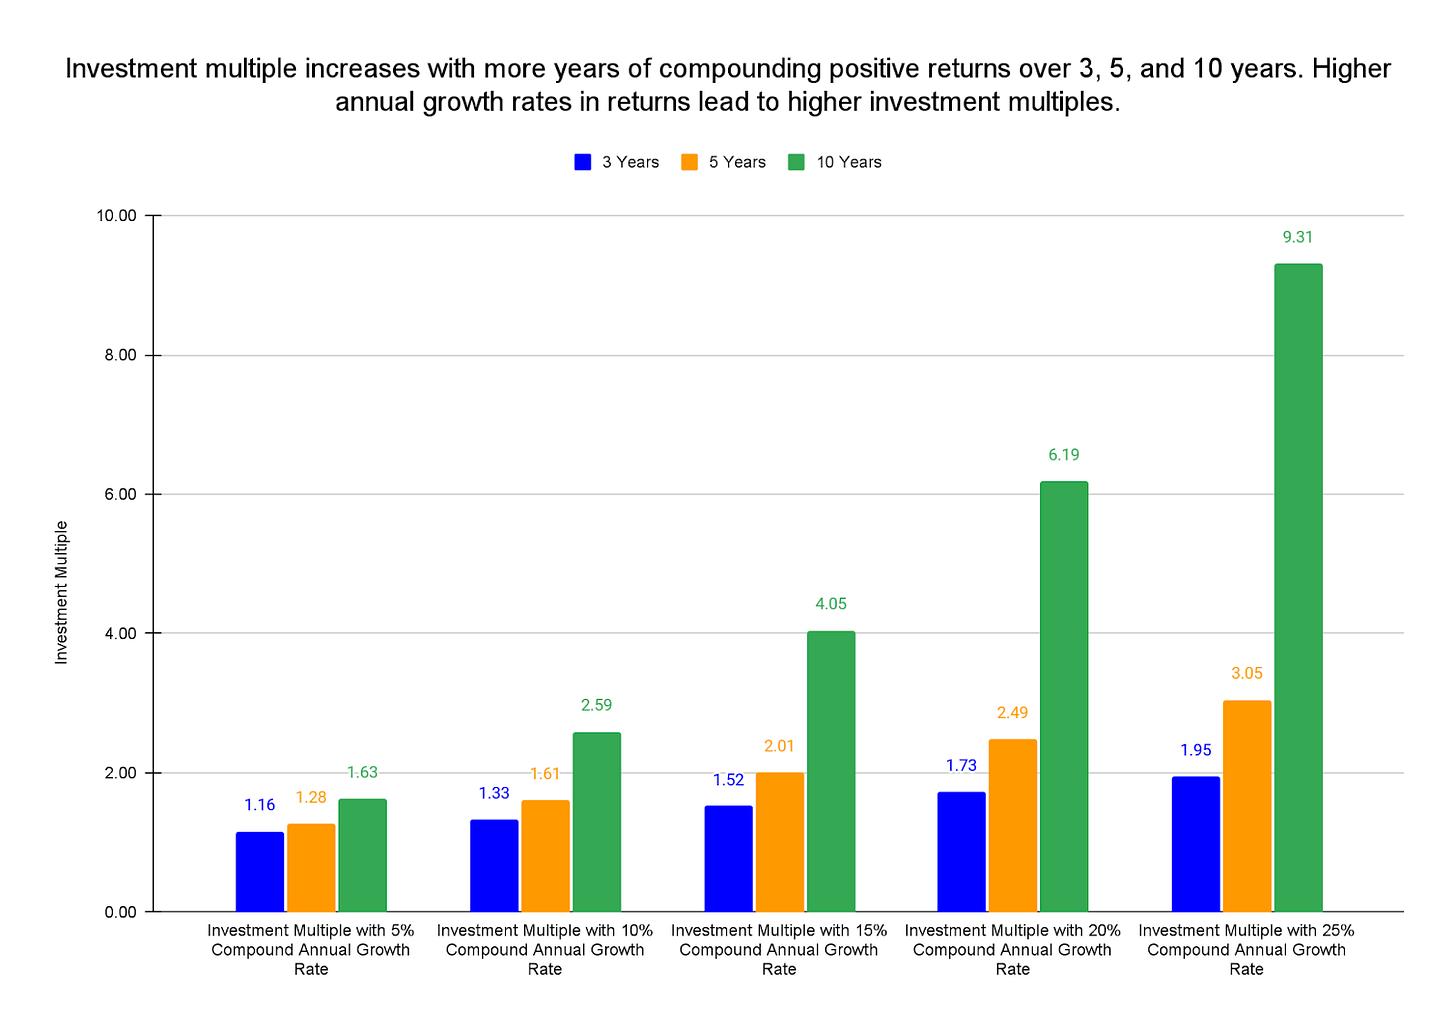
Key Insight: The multiplier in investments increases with more years of positive compounding returns, and higher annualized rates of return lead to higher investment multiples. For example, a 15% CAGR over 5 years leads to doubling the initial investment, while a 15% CAGR over 10 years leads to quadrupling the initial investment.
Case Study for Compounding Returns
Suppose an investor had a hypothetical example of investing an initial $100,000 investment with a 20% return over 20 years, with the choice of either 20% compounding returns or 20% linear returns.
As you can see, the difference between compounding returns and linear returns is quite significant.
In a linear return scenario that generates 20% from a $100,000 initial investment, then the annual return would hypothetically be $20,000 per year. In contrast, with a compounding annual return scenario, a hypothetical $100,000 initial investment that had a compounded annual growth rate of 20% for 20 years after taxes and fees amounts to about $3.8 million, or a huge 38 times return on initial investment.
Consistency Matters In Many Things in Life, Including Investment Returns
Consistency matters in long-term investment returns, and it’s important not to ruin the power of compounding returns. The previous charts illustrated the power of compounding returns, and ruining this advantage can disrupt total cumulative wealth creation.
Interestingly, consistently avoiding being in the bottom half of a category in every calendar year helps to become in the top quartile in long-term returns. This is also why risk management is important; if the extreme left tail is eliminated, then extreme right-tail performance isn’t required (although very much enjoyed) in order to achieve decent investment returns.
Emphasis on the Long Term: Case Study of Vanguard’s S&P 500 Index Fund (VOO) & Invesco’s NASDAQ 100 Index Fund (QQQ)
Key Insights:
Vanguard’s S&P 500 Index Fund under ticker symbol “VOO” is a good example of the idea that the best performance every year doesn’t need to be achieved every year in order to have a great long-term track record.
In the past 10 calendar years (2012-2021), VOO has always been in the top half of relative performance compared to the Large Blend category, indicating that quality index funds actually perform much better than the median.
From 2012-2021 and as displayed on the right-side chart, VOO was not in the top decile (top 10%) in individual calendar year performance in the Large Blend category.
VOO is in the top quartile (top 25%) in performance in the Large Blend category (as defined by Morningstar) over a trailing 5-year and 10-year time period (as displayed on the left-side chart). This historical data suggests that over these trailing time horizons, increasing the time horizon increases the likelihood that VOO is a better-performing fund compared to other investment funds in its Large Blend category.
Quick Note: In Morningstar’s ranking methodology, 1st percentile ranking is the best and 99th percentile ranking is the worst.
Similar insights can be derived for the QQQ ETF, which seeks to track the NASDAQ 100 Index and is among the best-performing funds (either index funds or actively managed funds) in the Large Growth category. The 2 charts below highlight this data from Morningstar:
Key Insights:
For each individual calendar year between 2012-2021, Invesco’s QQQ ETF (which seeks to track the NASDAQ 100 Index) has consistently ranked in the top one-third of all public funds in the “Large Growth” category, as defined by Morningstar.
Over the past 10 years, patience would have positively paid off in the form of strong returns. In the short-term (such as 1 week or 1 month), a 50+ ranking isn’t necessarily favorable, yet over a 3-year, 5-year, and 10-year time period, QQQ ranked in the top 5% of all public funds in the “Large Growth” category. This implies that over the past decade, consistency in the commitment to remaining invested in QQQ would have contributed to favorable returns for many investors. Of course, future performance can deviate from past results, the 2022 year thus far has been difficult in performance for QQQ and several other investment funds, and this illustration provides a sample data point for consideration.
Quick Check-In on the S&P 500 Index
Chart Description:
The above chart illustrates the historical annual calendar returns for the S&P 500 Index from 1990-2021 and includes the return for 2022 thus far as of October 14, 2022.
The calendar years with returns greater than 10% are highlighted in blue. The calendar years with negative returns are highlighted in red. The calendar years with returns between 0-10% are highlighted in grey.
The data is sourced from Koyfin.
Key Insights:
Double-Digit Performance is Common: The S&P 500 Index increased by more than 10% for more than half of the calendar years from 1990-2021.
Losses: From 1990-2021, the worst calendar year performance occurred in 2008. Four calendar years experienced a worse than -10% loss for the calendar year from 1990-2021. As of October 14, 2022, the S&P 500 Index is down about -25% for 2022.
Concluding Thoughts
Consistency has multiple forms; there can be funds that produce consistency in long-term returns, and there’s also an individual investor’s consistency to correctly keep investing.
Long-term consistency in positive investment returns can contribute to meaningfully significant outcomes in long-term wealth creation from investments.
Along with the awareness of risk and historical losses of index returns, risk management in portfolios is important.
An investor’s consistency in commitment to investing in highly-consistent funds also matters. As a result, theories in behavioral finance and the psychology of money are important in managing emotions, creating a financial plan, and drafting an investment policy to provide a roadmap in making and rebalancing investments.
Data-informed decision-making creates a framework for allocating investments in a portfolio. Successful investing is about identifying, investing in, and correctly sizing good investments in a portfolio.
Exponential growth is a powerful force. Higher compounding returns lead to higher investment multiples over time.
The power of compounding can be incredible, especially over long periods of time.
References:
Vanguard S&P 500 ETF (VOO), https://www.morningstar.com/etfs/arcx/voo/performance
Invesco NASDAQ 100 ETF (QQQ), https://www.morningstar.com/etfs/xnas/qqq/performance
Koyfin, https://www.koyfin.com/home
This letter is not an offer to sell securities of any investment fund or a solicitation of offers to buy any such securities. An investment in any strategy, including the strategy described herein, involves a high degree of risk. Past performance of these strategies is not necessarily indicative of future results. There is the possibility of loss and all investment involves risk including the loss of principal.
Any projections, forecasts and estimates contained in this document are necessarily speculative in nature and are based upon certain assumptions. In addition, matters they describe are subject to known (and unknown) risks, uncertainties and other unpredictable factors, many of which are beyond Drawing Capital’s control. No representations or warranties are made as to the accuracy of such forward-looking statements. It can be expected that some or all of such forward-looking assumptions will not materialize or will vary significantly from actual results. Drawing Capital has no obligation to update, modify or amend this letter or to otherwise notify a reader thereof in the event that any matter stated herein, or any opinion, projection, forecast or estimate set forth herein, changes or subsequently becomes inaccurate.
This letter may not be reproduced in whole or in part without the express consent of Drawing Capital Group, LLC (“Drawing Capital”). The information in this letter was prepared by Drawing Capital and is believed by the Drawing Capital to be reliable and has been obtained from sources believed to be reliable. Drawing Capital makes no representation as to the accuracy or completeness of such information. Opinions, estimates and projections in this letter constitute the current judgment of Drawing Capital and are subject to change without notice.


