Happy Holidays!
We are grateful to our audience. We wish you, your family, and friends a wonderful, festive, and happy holiday season.
We hope our published commentary is both helpful and insightful. As always, we welcome your feedback and topic suggestions.
Introduction
Today’s newsletter focuses on three topics:
Monthly performance for the S&P 500 and NASDAQ 100 indices
Review of historical data to see if a “December Rally” or “Holiday Enthusiasm” historically exists in the stock market
Summary of highlighted market news over the past week
Seasonality Effect and Average Monthly Price Changes in Each Month
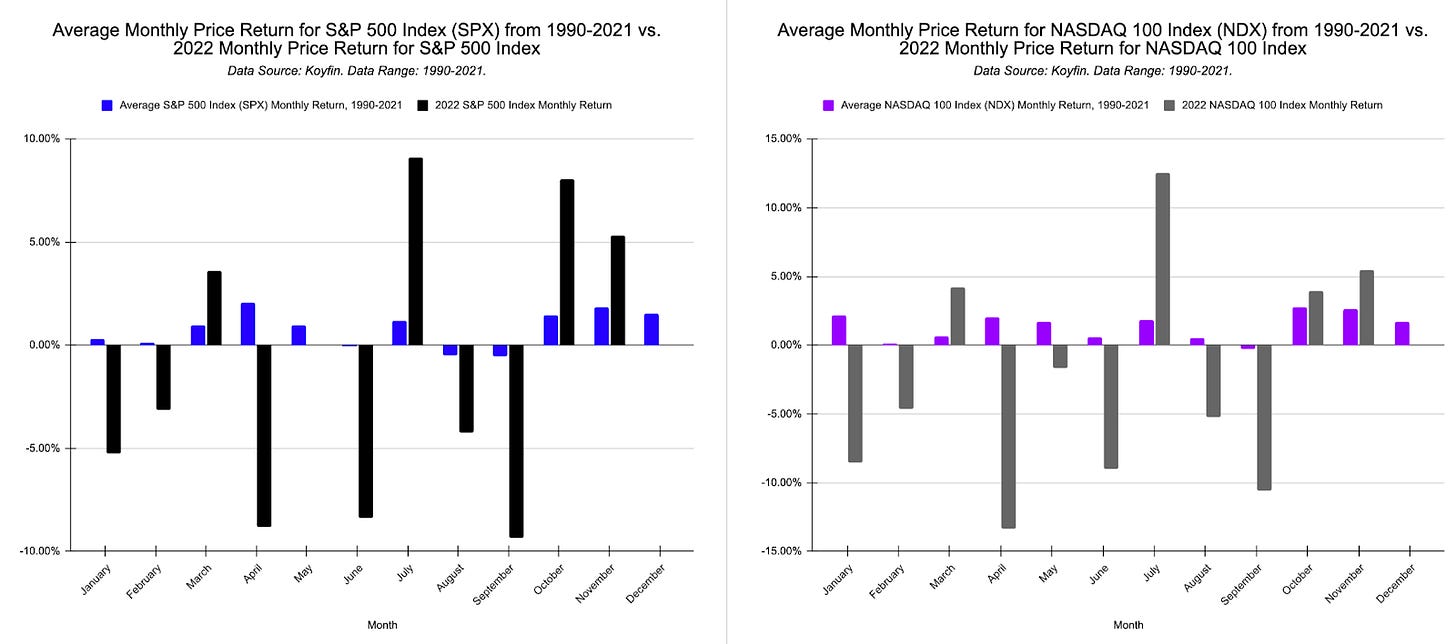
The two charts below show the average monthly returns for the S&P 500 Index and NASDAQ 100 Index from 1990-2021. There is seasonality in the data, and in the selected time range, percentage price changes across months are not equally distributed; some months have higher average performance than other months.
Holiday Enthusiasm? Checking in on Returns in December
Observations:
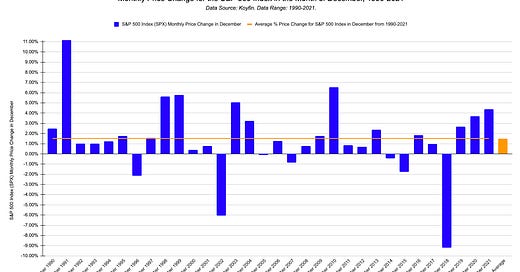
From 1990-2021, the average price change for the S&P 500 Index in the month of December is about +1.5%.
The S&P 500 Index had a positive price change in 25 out of the 32 December months between 1990-2021, which is about a 78% win rate.
Observations:
Holiday Enthusiasm: Historically on average, the S&P 500 Index and NASDAQ 100 Index have positive price changes in the month of December. Of course, future returns can deviate from past performance, and for the first 15 days of December 2022, both the S&P 500 and NASDAQ 100 indices have negative price performance.
The 2022 year has experienced higher volatility in monthly returns compared to historical averages. Throughout this year, there are often higher highs and lower lows when comparing the monthly returns in 2022 versus the average monthly returns from between 1990 to 2021 for the S&P 500 Index and NASDAQ 100 Index.
Highlighted Market News for This Past Week
Inflation: Earlier this week, the U.S. Bureau of Labor Statistics announced the inflation data for the month of November. The year-over-year change for CPI inflation was 7.1%, which remains at elevated levels yet is lower than the prior peak CPI inflation rate of 9% earlier this year in June 2022.
Source: U.S. Bureau of Labor Statistics, https://www.bls.gov/cpi/
Source: Federal Reserve, https://fred.stlouisfed.org/series/CPIAUCSL
Monetary Policy: The Federal Reserve increased the target Fed Funds rate by 50 basis points (0.50%), raising the target range to between 4.25% and 4.5%.
Source: Federal Reserve, https://www.federalreserve.gov/newsevents/pressreleases/monetary20221214a.htm
Treasury Yields: Interestingly, while the Federal Reserve raised the target range for the Fed Funds rate this past Wednesday (12/14/2022), US Treasury yields actually decreased between Monday and Thursday (12/12/2022 - 12/15/2022) for the 3-month yield, 2-year yield, 5-year yield, 10-year yield, and 30-year yield.
Source: U.S. Department of the Treasury, https://home.treasury.gov/policy-issues/financing-the-government/interest-rate-statistics?data=yield
Mortgage Rates: Sourced from data from the Primary Mortgage Market Survey ® by Freddie Mac:
The 30-year fixed rate mortgage fell to 6.31% (52-week range is between 3.05% and 7.08%).
The 15-year fixed rate mortgage fell to 5.54% (52-week range is between 2.3% and 6.38%).
Note: Individual experiences with mortgage rates can deviate from the aggregated survey statistics.
Source: Primary Mortgage Market Survey ® by Freddie Mac, Published 12/15/2022, https://www.freddiemac.com/pmms
Corporate Earnings: As of last Friday, Refinitiv stated that “of the 498 companies in the S&P 500 that have reported earnings to date for 22Q3 [Q3 2022], 70.9% have reported above analyst expectations. This compares to a long-term average of 66.2%”. It’s important to note that future corporate earnings (and by proxy, individual stock prices) perhaps may be significantly impacted next year if an economic recession, margin compression, or another major event occurs.
Source: “S&P 500 Earnings Dashboard Q3 2022” from Refinitiv, Dated 12/9/2022, https://lipperalpha.refinitiv.com/2022/12/this-week-in-earnings-22q3-dec-9-2022/
Oil and Energy:
Oil Prices: After exceeding $120 per barrel in June 2022, WTI crude oil prices have declined in the past few months (currently near $76 per barrel), providing some momentary relief to consumers despite gas prices at the pump still remaining at elevated levels compared to 2020 levels.
Source: U.S. Energy Information Administration (EIA), https://www.eia.gov/dnav/pet/hist/RWTCD.htm
Prices at the Pump: According to U.S. Energy Information Administration (EIA), retail average gasoline prices in America fell from about $5/gallon in mid-June 2022 to about $3.24/gallon in the past week. Of course, individual price experiences with filling up gas in vehicles can vary across geographic regions and individual gas stations, and this data is a national average from EIA.
Source: U.S. Energy Information Administration (EIA), https://www.eia.gov/petroleum/weekly/gasoline.php
Strategic Petroleum Reserve: According to the EIA, America’s Strategic Petroleum Reserve (SPR) had a weekly inventory level last week below 400 million barrels of crude oil. Aside from 2022, weekly inventory levels for the SPR haven’t been this low since 1984. Since the end of 2021, the SPR’s inventory level has fallen about -36%.
Source: “Weekly Petroleum Status Report, Data for Week Ended December 9, 2022”, U.S. Energy Information Administration (EIA), Published on 12/14/2022, Accessed 12/15/2022, https://www.eia.gov/petroleum/supply/weekly/pdf/wpsrall.pdf
Energy Stocks: The SPDR Energy Index fund (ticker symbol: XLE) is the best performing sector index fund in the past year among the 11 major sector index funds that track various S&P 500 Index sectors.
US Stock Market: According to data sourced from Koyfin as of December 15, 2022 (price change data is rounded):
Dow Jones Industrial Average (^INDU) is down -6.6% from a year ago.
S&P 500 Index (^SPX) is down -15.9% from a year ago.
Russell 2000 Index (^RTY) is down -17.8% from a year ago.
NASDAQ 100 Index is down -28.7% (^NDX) from a year ago.
These 4 popular stock market indices have experienced negative percentage changes in prices over the past year.
The S&P 500 Index, Russell 2000 Index, and NASDAQ 100 Index are at index prices below their respective 200-day daily simple moving averages, indicating unenthusiastic sentiment among many investors at this time.
Tesla: Tesla’s stock has fallen more than -50% since the start of 2022, and Tesla’s stock has fallen more than 60% since its prior peak price in early November 2021 (data from Koyfin as of 12/15/2022). This stock price movement for Tesla marks among the largest drawdowns in the company’s history as a public company. Tesla went public via an IPO in June 2010.
Retail Sales and Business Inventories (data and press releases from United States Census Bureau):
Business inventories are rising while estimated monthly retail sales fell month-over-month, demonstrating a sign of slowdowns in economic growth and growth in consumer spending activity.
According to data from the United States Census Bureau published yesterday, the estimated business inventory/sales ratio rose from 1.25 in October 2021 to 1.33 in October 2022.
According to yesterday’s press release, “Advance estimates of U.S. retail and food services sales for November 2022, adjusted for seasonal variation and holiday and trading-day differences, but not for price changes, were $689.4 billion, down 0.6 percent (±0.5 percent) from the previous month”.
According to yesterday’s press release, “Retail trade sales were down 0.8 percent (±0.5 percent) from October 2022”.
According to yesterday’s press release, “Manufacturers’ and trade inventories for October, adjusted for seasonal and trading day differences but not for price changes, were estimated at an end-of-month level of $2,468.3 billion, up 0.3 percent (±0.1 percent) from September 2022 and were up 16.5 percent (±0.4 percent) from October 2021.”
Source: “Business Inventories”, United States Census Bureau, Published December 15, 2022, https://www.census.gov/economic-indicators/
Source: “Advance Monthly Retail Sales”, United States Census Bureau, Published December 15, 2022, https://www.census.gov/economic-indicators/
Travel
Safe travels, everyone!
Based on TSA passenger checkpoint data, domestic airline travel by passenger volume has nearly returned back to 2019 pre-pandemic levels, as seen by the convergence between the black line (2019 year) and blue line (2022 year) in the chart below.
The rolling seven-day average of airline passengers traveling through TSA checkpoints in 2020 (red line in the chart below) obviously plunged lower due to the coronavirus crisis.
Travel and tourism are booming with popularity in 2022. Since March 2022, it has become routine to have more than 2 million check-ins at TSA checkpoints on a daily basis.
Source: “TSA Checkpoint Travel Numbers”, Transportation Security Administration, U.S. Department of Homeland Security, https://www.tsa.gov/coronavirus/passenger-throughput
___
References:
“Consumer Price Index”, U.S. Bureau of Labor Statistics, Accessed 12/15/2022, https://www.bls.gov/cpi/
“Consumer Price Index”, Federal Reserve Economic Database (FRED) and U.S. Bureau of Labor Statistics (BLS), Accessed 12/15/2022, https://fred.stlouisfed.org/series/CPIAUCSL
“Federal Reserve issues FOMC Statement”, Federal Reserve, Published 12/14/2022, Federal Reserve, https://www.federalreserve.gov/newsevents/pressreleases/monetary20221214a.htm
“Daily Treasury Par Yield Curve Rates”, U.S. Department of the Treasury, Accessed 12/15/2022, https://home.treasury.gov/policy-issues/financing-the-government/interest-rate-statistics?data=yield
Primary Mortgage Market Survey ® by Freddie Mac, Published 12/15/2022, Accessed 12/15/2022, https://www.freddiemac.com/pmms
“S&P 500 Earnings Dashboard Q3 2022 | Dec. 9, 2022”, Refinitiv, Dated 12/9/2022, Accessed 12/15/2022, https://lipperalpha.refinitiv.com/2022/12/this-week-in-earnings-22q3-dec-9-2022/
“WTI Spot Price in Cushing, OK”, U.S. Energy Information Administration (EIA), Accessed 12/15/2022, https://www.eia.gov/dnav/pet/hist/RWTCD.htm
“Regular Gasoline Retail Prices (dollars per gallon”, “This Week in Petroleum” by U.S. Energy Information Administration (EIA), Published 12/14/2022, Accessed 12/15/2022, https://www.eia.gov/petroleum/weekly/gasoline.php
“Weekly Petroleum Status Report, Data for Week Ended December 9, 2022”, U.S. Energy Information Administration (EIA), Published on 12/14/2022, Accessed 12/15/2022, https://www.eia.gov/petroleum/supply/weekly/pdf/wpsrall.pdf
“Tesla Announces Pricing of Initial Public Offering”, Tesla Investor Relations, Published 6/27/2010, https://ir.tesla.com/press-release/tesla-announces-pricing-initial-public-offering
“TSA Checkpoint Travel Numbers”, Transportation Security Administration, U.S. Department of Homeland Security, Accessed 12/15/2022, https://www.tsa.gov/coronavirus/passenger-throughput
“Business Inventories”, United States Census Bureau, Published 12/15/2022, Accessed 12/15/2022, https://www.census.gov/economic-indicators/
“Advance Monthly Retail Sales”, United States Census Bureau, Published 12/15/2022, Accessed 12/15/2022, https://www.census.gov/economic-indicators/
This letter is not an offer to sell securities of any investment fund or a solicitation of offers to buy any such securities. An investment in any strategy, including the strategy described herein, involves a high degree of risk. Past performance of these strategies is not necessarily indicative of future results. There is the possibility of loss and all investment involves risk including the loss of principal.
Any projections, forecasts and estimates contained in this document are necessarily speculative in nature and are based upon certain assumptions. In addition, matters they describe are subject to known (and unknown) risks, uncertainties and other unpredictable factors, many of which are beyond Drawing Capital’s control. No representations or warranties are made as to the accuracy of such forward-looking statements. It can be expected that some or all of such forward-looking assumptions will not materialize or will vary significantly from actual results. Drawing Capital has no obligation to update, modify or amend this letter or to otherwise notify a reader thereof in the event that any matter stated herein, or any opinion, projection, forecast or estimate set forth herein, changes or subsequently becomes inaccurate.
This letter may not be reproduced in whole or in part without the express consent of Drawing Capital Group, LLC (“Drawing Capital”). The information in this letter was prepared by Drawing Capital and is believed by the Drawing Capital to be reliable and has been obtained from sources believed to be reliable. Drawing Capital makes no representation as to the accuracy or completeness of such information. Opinions, estimates and projections in this letter constitute the current judgment of Drawing Capital and are subject to change without notice.


