

Housing Trends and the State of Public REITs
Housing Trends and the State of Public REITs
Weekly updates on the innovation economy.

Drawing Capital Newsletter
November 13, 2020

Recent Housing Trends
In the Bay Area, we’ve all heard about the “exodus” of people moving from densely populated cities like San Francisco to more spacious dwellings with a better quality of life, now supported by work-from-home policies and low-interest rates. Today, we will be reviewing some of the shifts in population across the country, as well as the translation to the public REIT landscape.
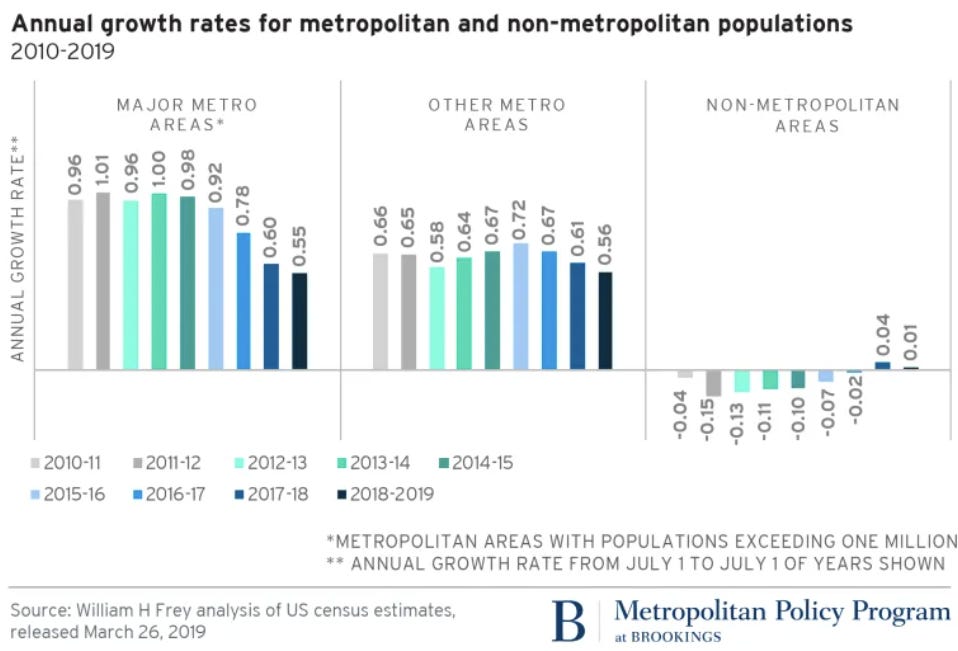
Even prior to the outbreak of COVID-19, population growth in metropolitan areas was stagnating. As depicted in the figure below from the Brookings Institute, there has been a steady decline in population growth from metro areas to non-metro areas over the last 10 years.
We can also examine this more closely by zooming in on specific cases of densely populated counties. In particular, the District of Columbia, San Francisco County, and Kings County (Brooklyn), New York, which have all seen a dramatic decline in annual growth rates since 2012.
In reported data, even prior to the pandemic, both San Francisco and Kings Counties were experiencing more residents leaving than entering, starting at about 1.25% growth in 2010-2011 to roughly 0.15% and -0.65%, respectively.

Pandemic Housing Trends
Although the trends in domestic migration were gaining momentum prior to the proliferation of the pandemic, policies to counteract COVID-19 reinforced the desire for both the quantity and quality of living space.
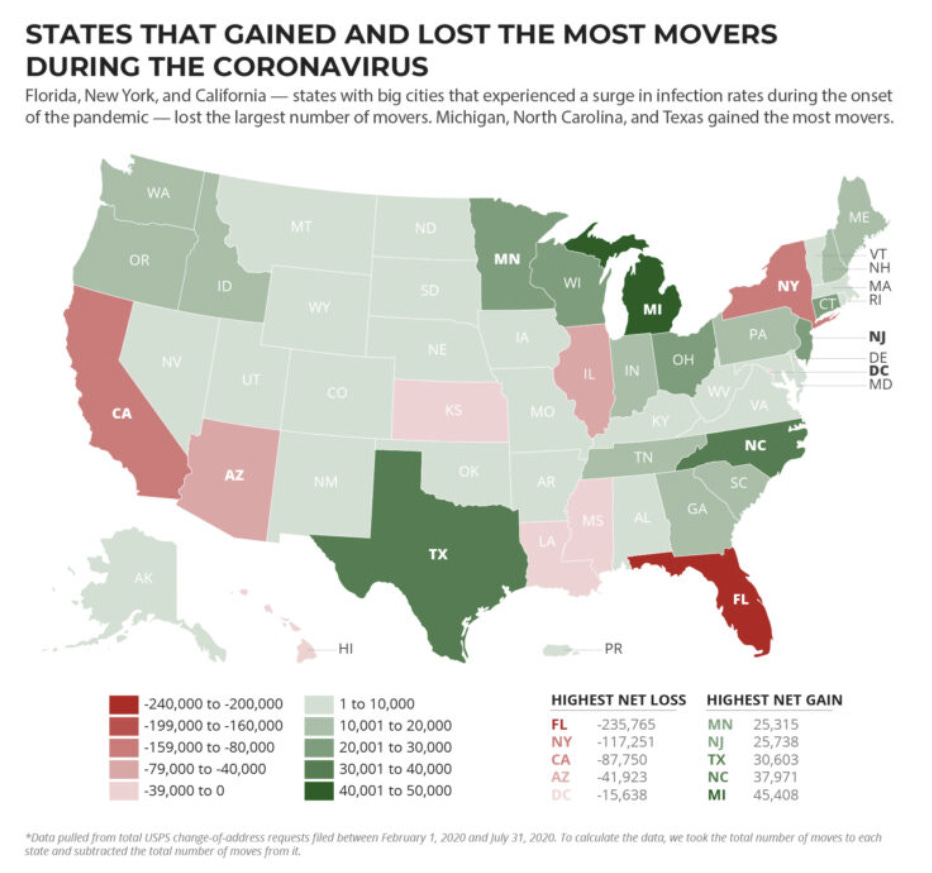
When we evaluate the trends of population growth (or decline) during the COVID-19 pandemic, based on USPS change-of-address filings, we find that the states with the greatest changes from February 1, 2020, through July 31, 2020, are:
Net Losers
Florida (-235,765)
New York (-117,251)
California (-87,750)
Net Gainers
Michigan (+45,408)
North Carolina (+37,971)
Texas (+30,603)

Single Family Home Market
On a national level, it is abundantly clear that the housing market has continued to show significant strength despite the temporary slowdown in early-2020. This is supported primarily by historically low-interest rates and the increasing ability to work from home.
As measured by Redfin on 11/10/2020:
Median sales prices have increased by 14.4% year-over-year (YoY)
The number of homes sold has increased by 21.7% YoY
Housing supply is at a 5-year low
Homes that sold above list price are up 11.3% YoY
Homes with a price drop decreased 8% YoY
While the housing market has been wonderful for single-family home sellers and real estate agents, public REIT holders have experienced a difficult year. This has created a significant drag on portfolios that incorporate REIT funds as a part of their asset allocation strategy, including the models for Robo-advisors, which have gained significant popularity in recent years.
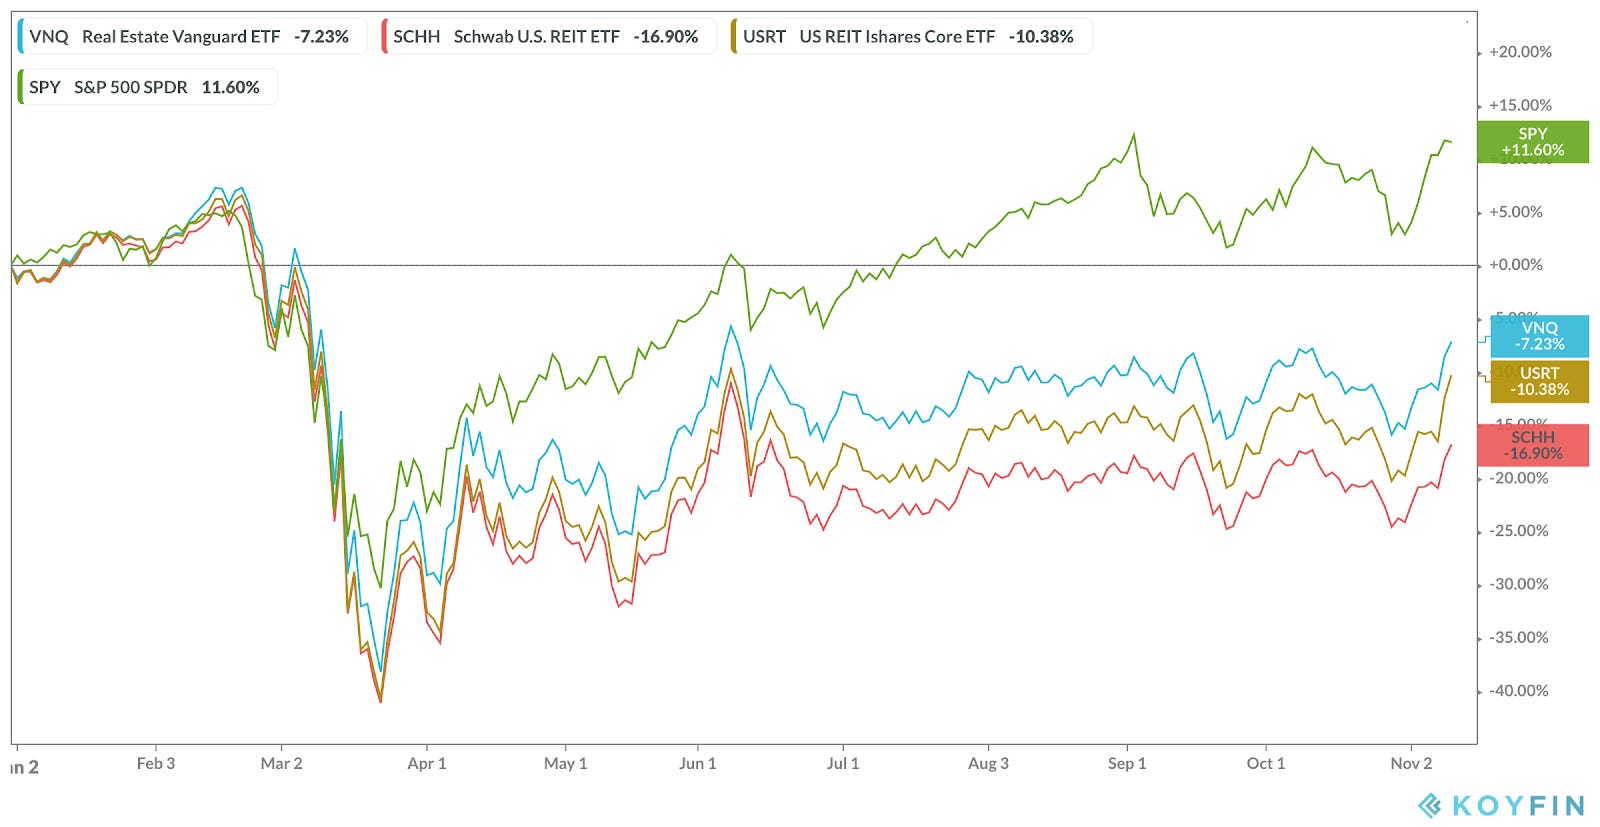
Contrary to the sizeable recovery of the S&P 500 index from mid-March, the national real estate market has posted high single-digit to low double-digit negative returns. This is depicted below by the Vanguard Real Estate ETF (VNQ), Schwab U.S. REIT ETF (SCHH), and iShares Core US REIT ETF (USRT).
Despite the single-family home market that most of us are familiar with, the rest of the real estate market tells a very different story. The composition of public REIT funds, which are fundamentally equities with indirect exposure to real estate, have been disastrous. Year-to-date, through 10/30/2020, the worst subsectors of REITs have performed as follows:
Retail; Regional Malls: -54.07%
Lodging/ Resorts: -50.33%
Retail; Shopping Centers: -48.24%
Diversified: -36.76%
Office: -35.97%
Mortgage REITs: -35.96%
While the only positive performing subsectors have been:
Data Centers: +22.61%
Self Storage: +10.96%
Industrial: +8.51%
Infrastructure: +7.35%
The enormous difference between the best-performing and worst-performing sectors of REIT sub-sectors highlight the acceleration of certain trends (e-commerce, logistics, digital payments, data infrastructure, housing relocation) and the deceleration of other trends in a coronavirus-driven lockdown mode, such as travel, leisure, office space, and in-person shopping.

Closing Remarks
Over the course of the year, we’ve seen the relocation of hundreds of thousands of residents, especially from larger, more densely populated cities to the suburbs. Initial reactions suggested that the trend was largely due to COVID, but as we find from the Brookings Institute, the move from metropolitan to non-metropolitan has been underway for the last decade. This was further exacerbated by lower interest rates, with the average 30-yr fixed mortgage at 2.9% according to Redfin, and a more-than-favorable equity market.
Conversely, industries like lodging and hotels, shopping centers, office space, and regional malls have suffered insurmountable losses, not only for those directly involved, but also for investors trying to maintain a diversified portfolio through publicly-traded REITs. As we’ve stated in past newsletters, the events of 2020 have influenced a massive change in behavior across the population, which have materialized in unexpected changes to company valuations and asset classes across the board.

References
“Even Before coronavirus, census shows U.S. cities’ growth was stagnating.” https://www.brookings.edu/research/even-before-coronavirus-census-shows-u-s-cities-growth-was-stagnating/. Accessed 10 Nov. 2020.
“Coronavirus Moving Study: People Left Big Cities, Temporary Moves Spiked In First 6 Months of COVID-19 Pandemic.” https://www.mymove.com/moving/covid-19/coronavirus-moving-trends/. Accessed 10 Nov. 2020.
“United States Housing Market.” https://www.redfin.com/us-housing-market. Accessed 10 Nov. 2020.
“Performance by Property Sector/ Subsector.” https://www.reit.com/data-research/reit-indexes/historical-reit-returns/performance-property-sector-subsector. Accessed 10 Nov. 2020.
This letter may not be reproduced in whole or in part without the express consent of Drawing Capital Group, LLC (“Drawing Capital”). This letter is not an offer to sell securities of any investment fund or a solicitation of offers to buy any such securities. An investment in any strategy, including the strategy described herein, involves a high degree of risk. Past performance of these strategies is not necessarily indicative of future results. There is the possibility of loss and all investment involves risk including the loss of principal.
The information in this letter was prepared by Drawing Capital and is believed by the Drawing Capital to be reliable and has been obtained from sources believed to be reliable. Drawing Capital makes no representation as to the accuracy or completeness of such information. Opinions, estimates and projections in this letter constitute the current judgment of Drawing Capital and are subject to change without notice.
Any projections, forecasts and estimates contained in this document are necessarily speculative in nature and are based upon certain assumptions. In addition, matters they describe are subject to known (and unknown) risks, uncertainties and other unpredictable factors, many of which are beyond Drawing Capital’s control. No representations or warranties are made as to the accuracy of such forward-looking statements. It can be expected that some or all of such forward-looking assumptions will not materialize or will vary significantly from actual results. Drawing Capital has no obligation to update, modify or amend this letter or to otherwise notify a reader thereof in the event that any matter stated herein, or any opinion, projection, forecast or estimate set forth herein, changes or subsequently becomes inaccurate.