


Internet Scale Businesses
The total addressable markets ("TAM") for several industries and sectors have been expanded by global internet distribution. A quick example illustrates this fact:
If you operate a gas station, your addressable market is restricted to travelers, car renters, and car owners in your locality.
If you operate a social network or online store, your theoretical addressable market is anyone that has access to the internet.
With massive distribution at scale with reasonably low variable costs, internet scale businesses benefit from significant secular tailwinds with a growing total addressable market that is currently worth tens of trillions of dollars.
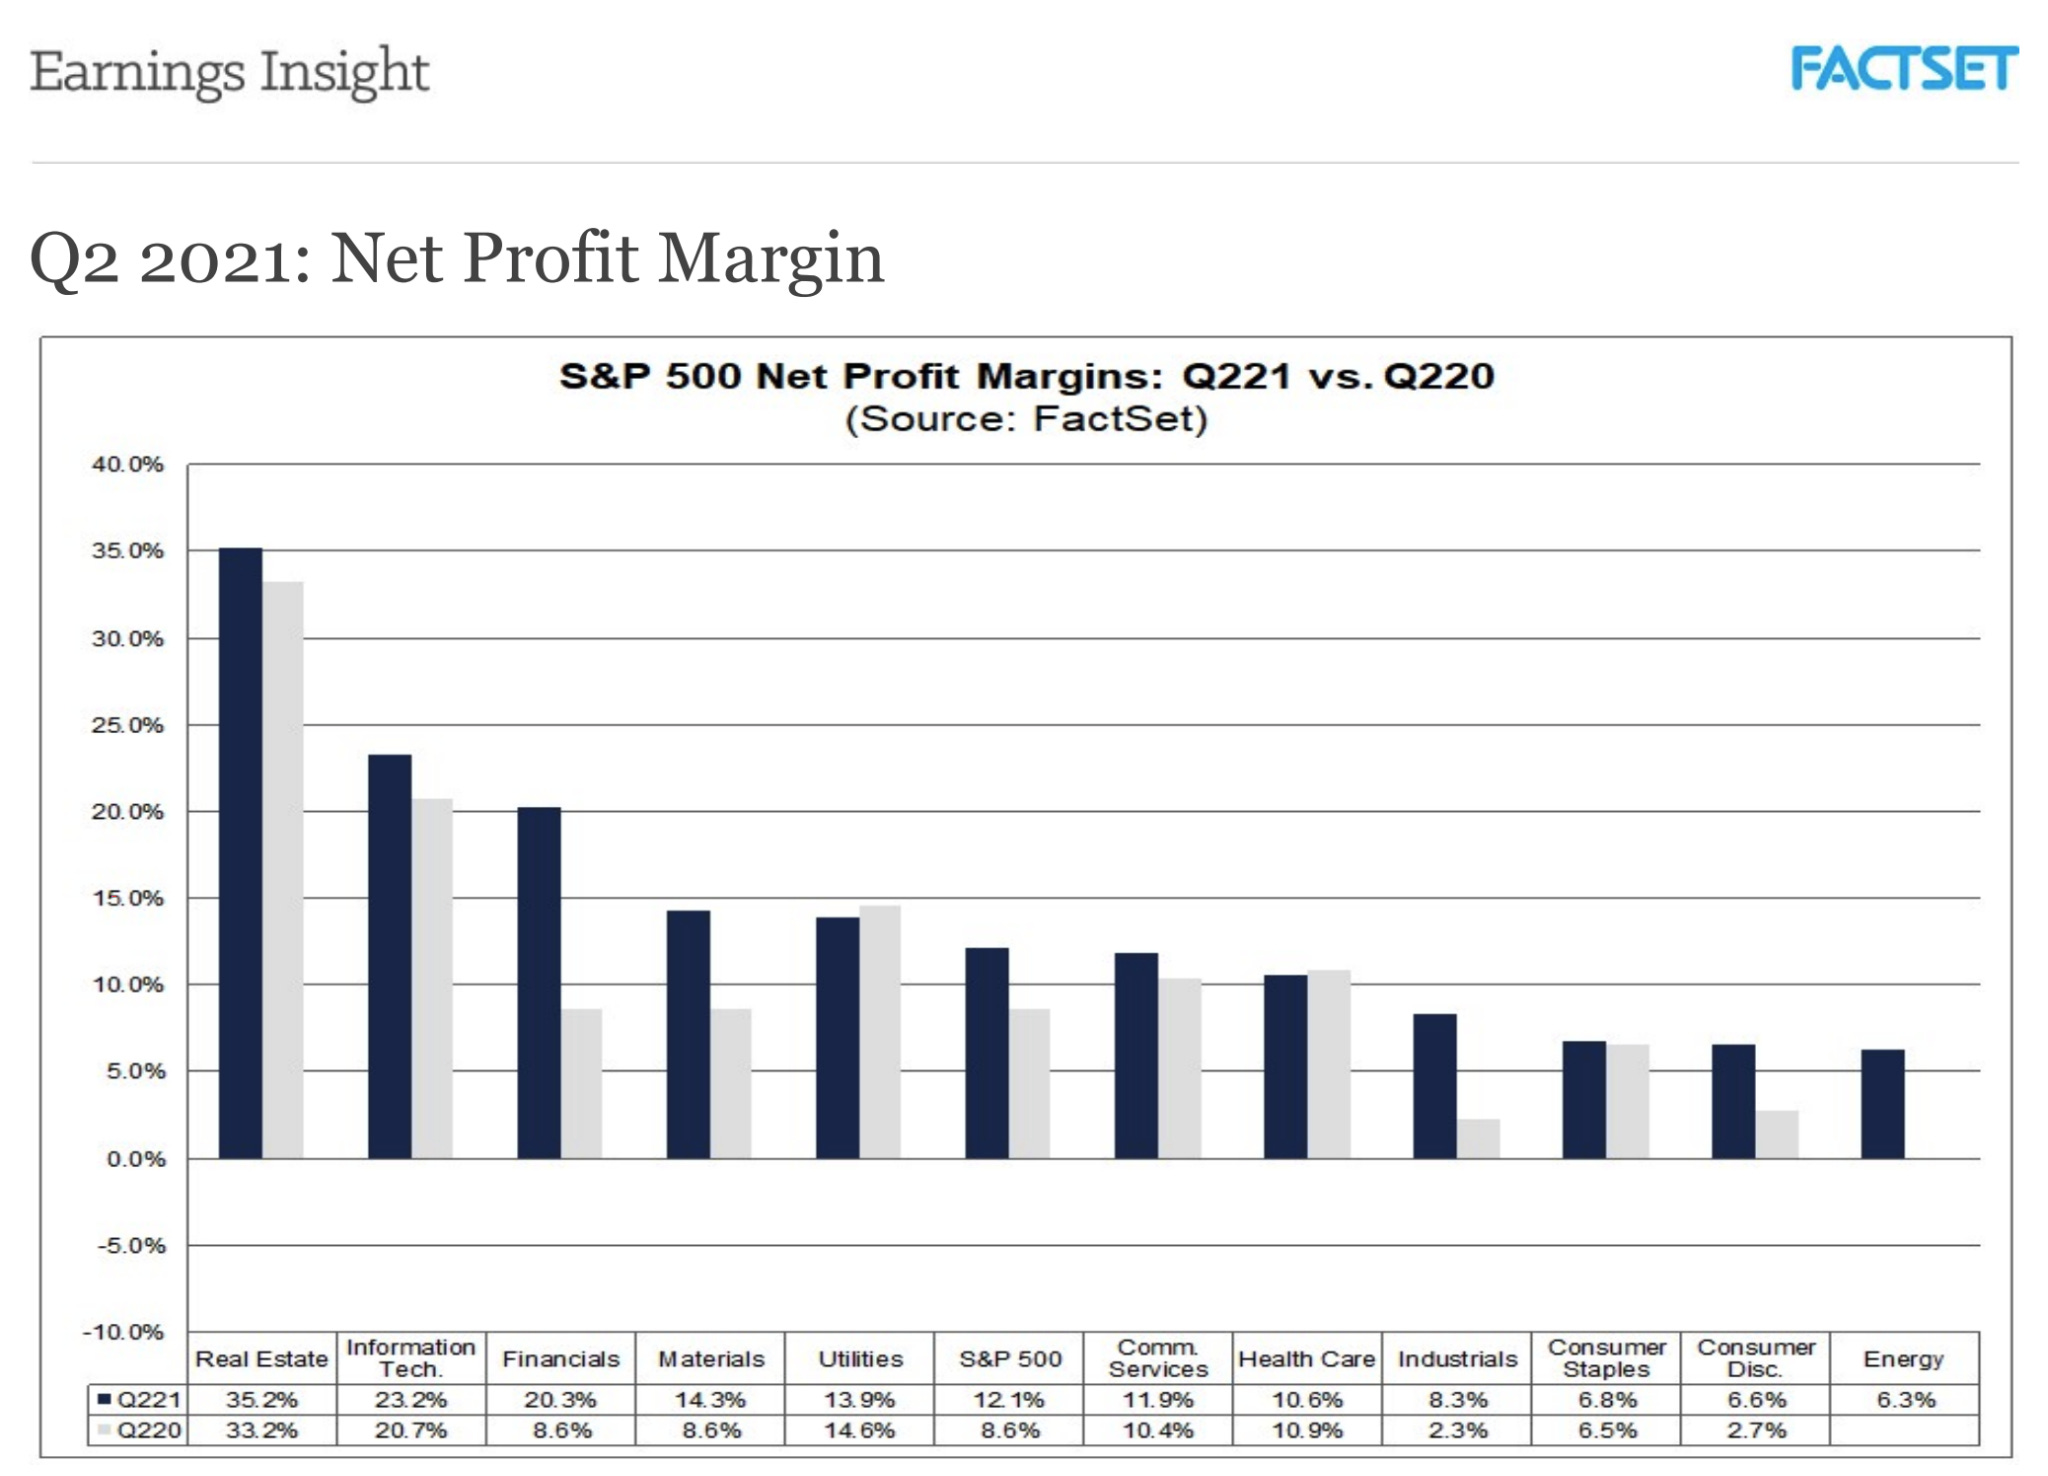
Profit Margins
As displayed by the chart from FactSet below, the information technology sector within the S&P 500 generated the second-largest net profit margin in Q2 2020 among all S&P 500 sectors.
Tracking Big Tech: The FANGMAN Companies
The “FANGMAN” acronym stands for 7 companies: Facebook, Amazon, Netflix, Google / Alphabet, Microsoft, Apple, and NVIDIA.
Recently, the cumulative market valuations of these 7 companies exceeded the $10 trillion milestone in July 2021. Importantly, all 7 of these companies share the following trait of being platform technology companies. Drawing Capital’s additional commentary about FANGMAN companies can be found at a blog post in early August 2021 at this link:


Historical Context & Changing Landscape for the Largest Companies in the World
For the top companies by market valuation, change is the only constant over time. The combination of creative destruction, rise and fall of specific industries and companies, technological progress, free cash flow generation capabilities, and the ability to better broadly serve larger customer bases are several of the key factors that influence the size of the top companies by market cap over time. The following chart from the Economic Research Council highlight the changing landscape for the top global companies by market cap from 1999-2019:

The following chart below highlights the 100 largest companies in the world as of March 2021, with many being technology companies and geographically headquartered in America.

For many traditional physical businesses and industrial companies, the combination of diminishing marginal benefits of scale after a certain size and increased organizational complexity place an artificial ceiling on the growth prospects of these types of businesses. On the other hand, this artificially-defined growth ceiling vanishes for internet scale businesses that operate as technology platforms with low marginal costs, high degree of network effects, high product market fit with customers, and strong distribution channels. By definition, positive network effects imply that as a company gains more customers, all of the previous customers also benefit via a better product or service, which creates an accumulating competitive advantage with increasing marginal utility with greater size, scope, and scale. As a result and with the benefits of software, internet scale businesses can continue to grow at scale and command significant company valuations.
As “software continues to eat the world”, more and more software companies will become several of the largest companies in the world. We can visualize this via the following two charts from WisdomTree:

WisdomTree’s cloud computing fund under ticker symbol “WCLD” seeks to track a basket of cloud software companies. As of June 30, 2021, the basket of cloud software companies under fund ticker symbol “WCLD” have higher revenue growth rates, gross margins, and efficiency scores compared to the S&P 500 Index:

Additionally, people’s usage of software products over time has been rapidly increasing in aggregate, as measured by both level of consumption and the number of minutes per day. The following chart from Visual Capitalist highlights the immense size, scale, and scope of internet usage in 2020:

With so much data consumption by enterprises and consumers, it is no surprise that the market cap valuations of cloud software companies has dramatically risen, as seen by the following chart from Bessemer Venture Partners:

A Virtuous Cycle
A virtuous cycle exists within software business models, and this virtuous cycle is amplified by these three key characteristics:
There exists a strong relationship between data quantity and quality of models for applications in artificial intelligence and machine learning.
Data is a valuable asset, and access to differentiated and high quality datasets generates compounding benefits.
The combination of network effects, asymmetric information, increasing returns to scale, and technological advantages have enabled many internet scale companies and digital businesses to experience a “winner take most” market environment and become category leaders.
Historical Performance
From an investor return perspective and based on the following chart below, we can see the positive and significant returns of select funds that track software, cloud computing, and internet scale businesses.
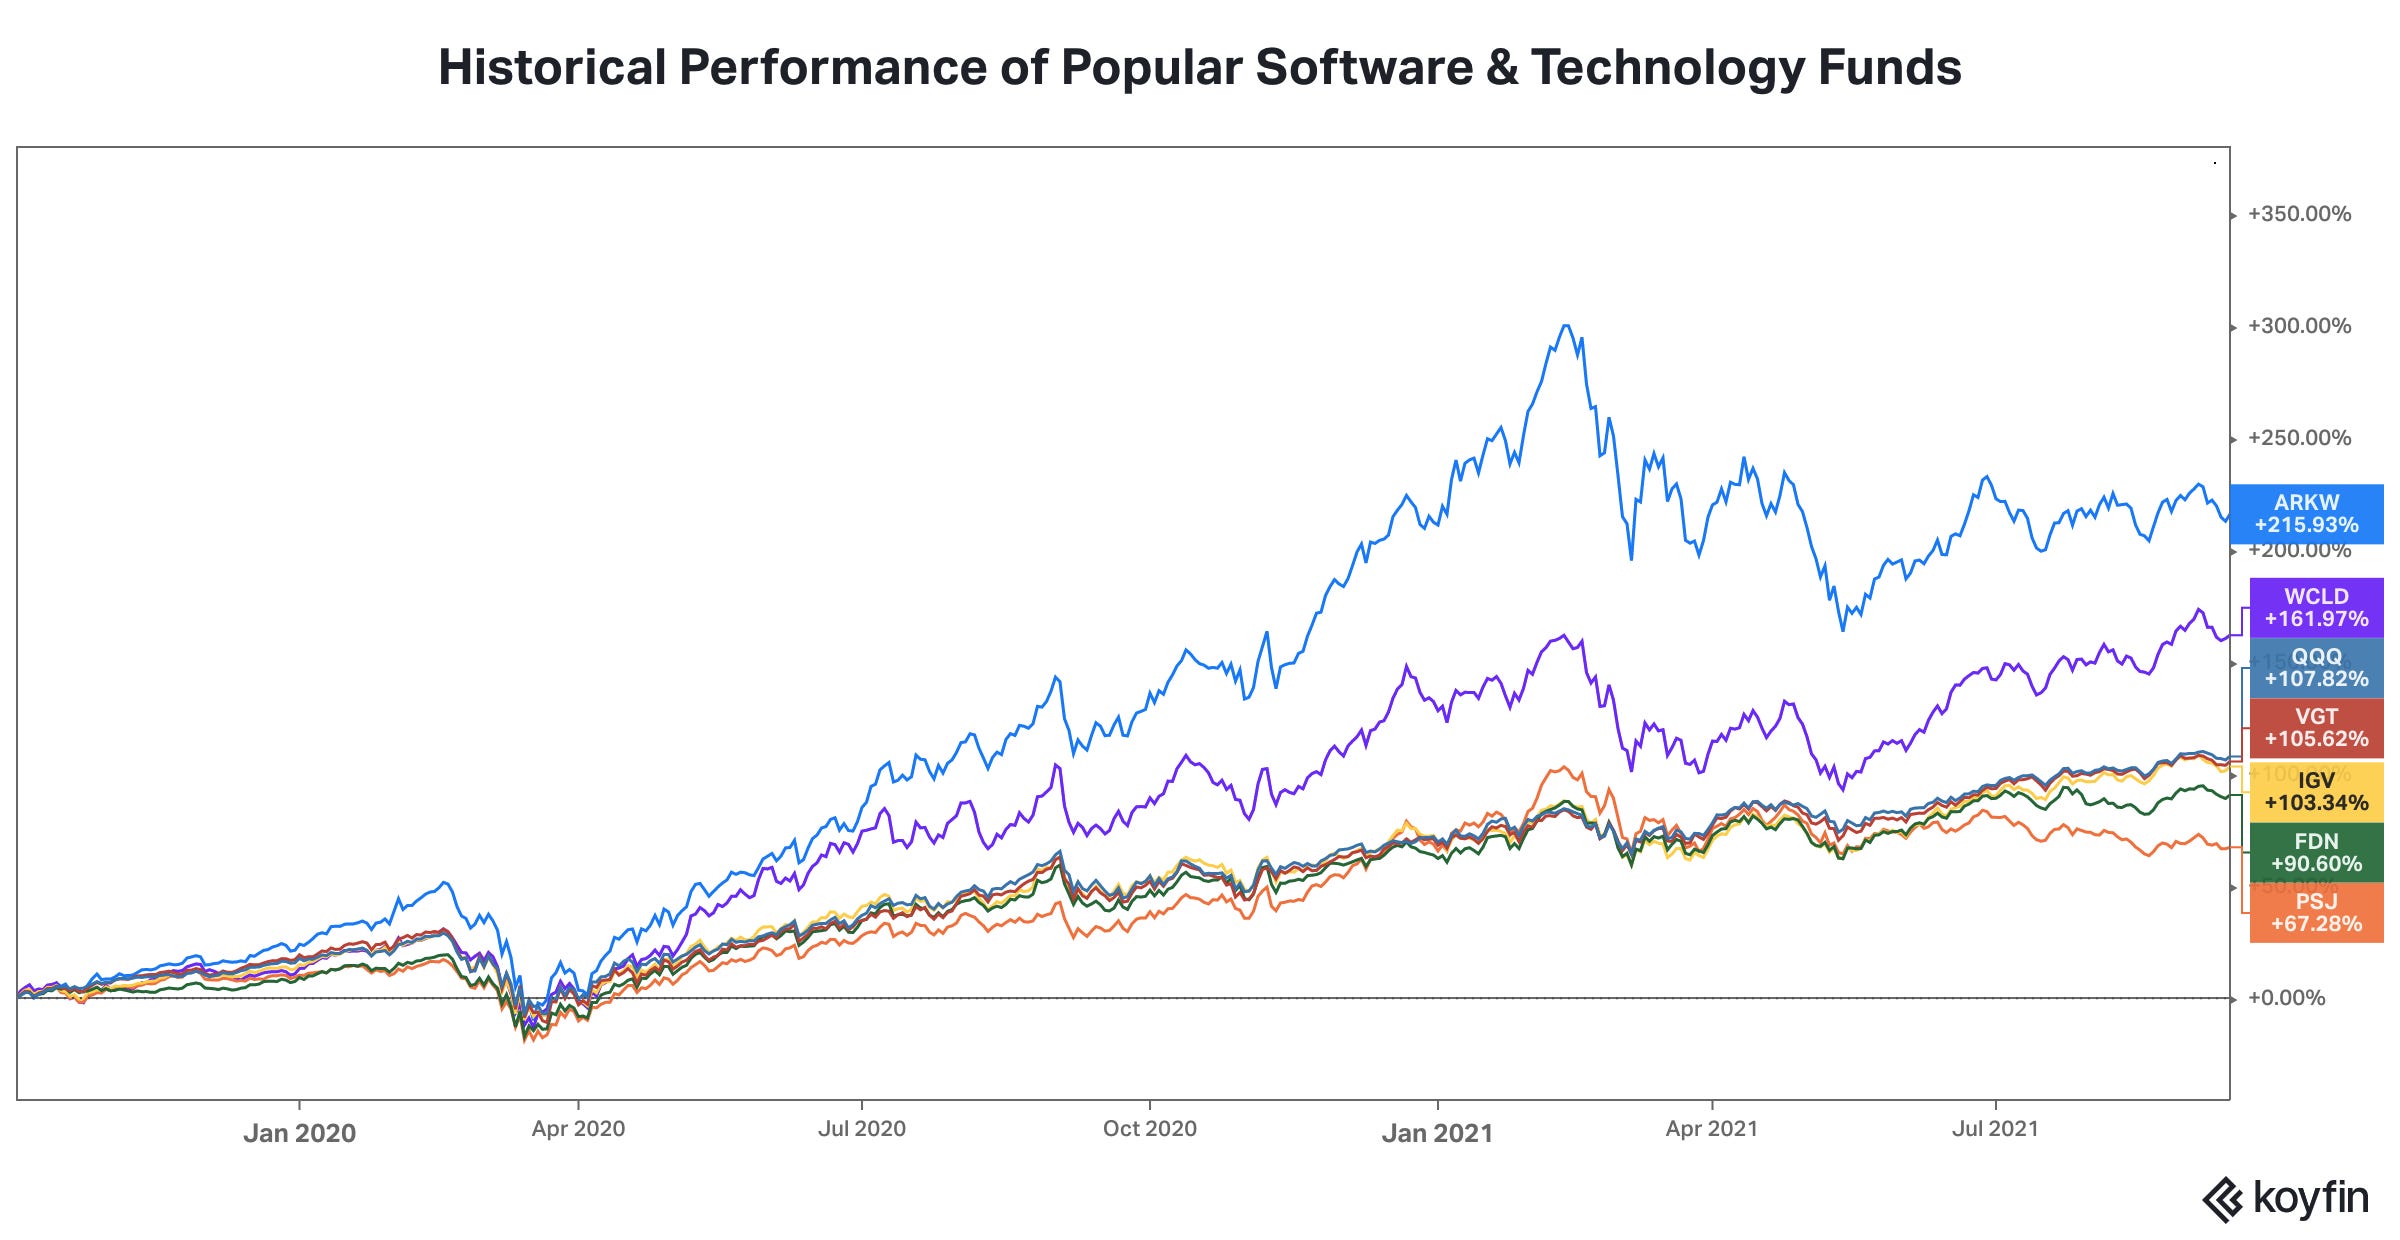
The following list connects the ticker symbols in the above chart with the names of these funds:
ARKW: ARK Next Generation Internet ETF
WCLD: WisdomTree Cloud Computing ETF
PSJ: Invesco Dynamic Software ETF
IGV: iShares Expanded Tech Software Sector ETF
FDN: First Trust Dow Jones Internet Index ETF
VGT: Vanguard Information Technology ETF
QQQ: Invesco NASDAQ 100 Index ETF

Interestingly, while VGT, IGV, FDN, and PSJ have similar annualized returns over the past 10 years, their top 5 holdings in these funds vary significantly, suggesting that a diversity of software investments (as opposed to just a concentrated handful of trending companies) were useful in generating these historical returns. For example, here were the top 5 holdings with ticker symbols for these 5 funds as of September 14, 2021:


From Q1 2011 to Q1 2021, America’s GDP grew at a ~3.74% compounded annualized growth rate, which is significantly lower than the ~23% annualized growth rate of the software-focused index funds presented above. The key insight is that betting on American software has been far more lucrative than betting on the general state of the American economy. The technology industry (and in particular, the software category) has enjoyed significant secular tailwinds over the past decade, has experienced revenue acceleration during the coronavirus crisis, and is well-positioned for growth and business model expansion in a post-pandemic world.
Looking at the Future
Given the significant historical gains and performance returns, a reader may ask the following question, “Is cloud software overrated, and is the cloud computing trend over after the coronavirus crisis?” The answer to both of these questions is a definitive “no”. It is true that many cloud software companies enjoyed significant growth in revenues and their stock prices in 2020, and the coronavirus crisis accelerated the adoption of many technologies and products. Despite this acceleration and despite the trendy topic of “digital transformation”, adoption of cloud computing remains in its early innings.
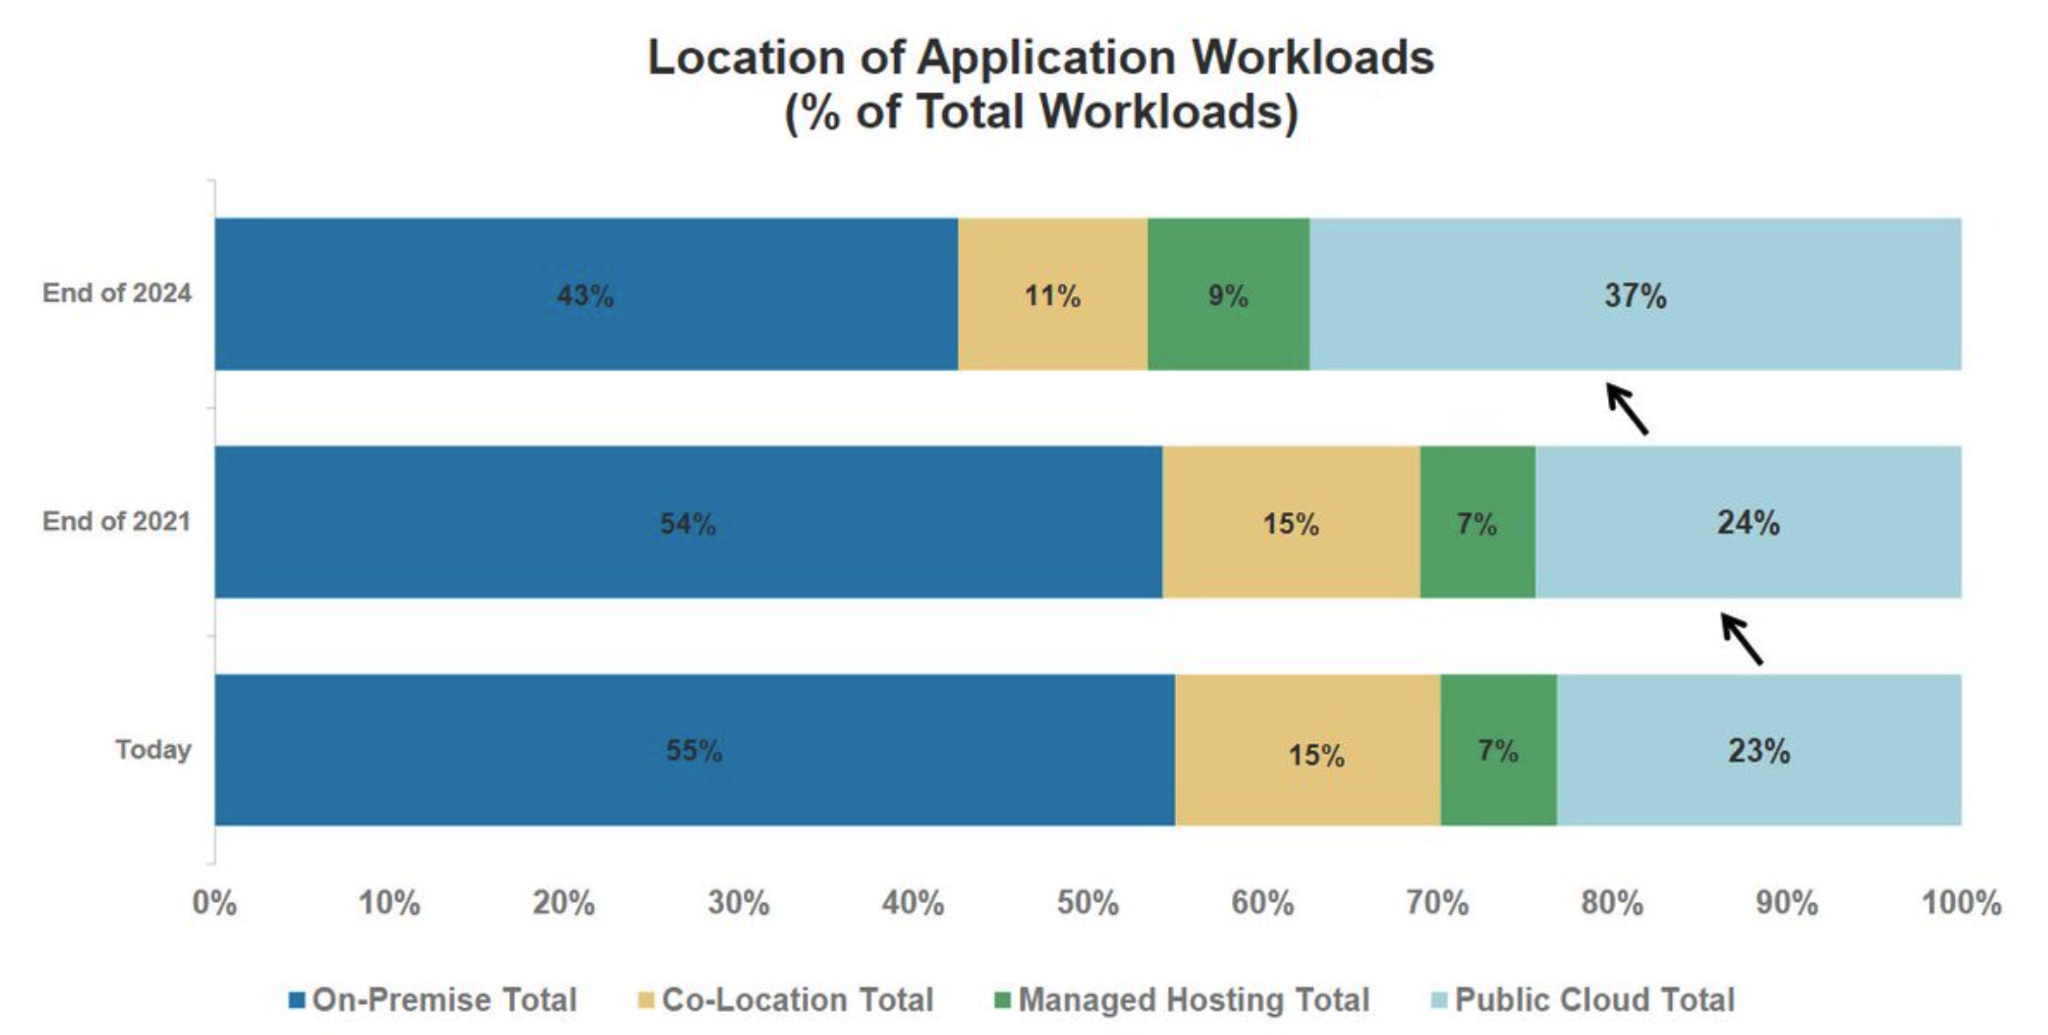
Looking at the chart above from Morgan Stanley’s Chief Information Officer Survey that was shared by Jamin Ball at Altimeter Capital, less than 25% of application workloads reside in the public cloud today, which demonstrates a significant expansion opportunity ahead. Research from Morgan Stanley, Drawing Capital, ARK Investments, and several other investment firms continue to seek out and invest in cloud software companies.
Concluding Thoughts
FANGMAN companies collectively reaching a combined $10 trillion in market cap represents a significant milestone and demonstrates the size, scale, and scope of Big Tech companies. In aggregate, FANGMAN companies continue to grow revenues, generate significant cash flows, maintain high returns on capital, and innovate at scale.
It is abundantly clear that software companies benefit from a significant secular tailwind. In aggregate, software companies continue to grow in revenue, business size, and in relative market share within the S&P 500.
We are of the opinion that Big Tech companies continue to be undervalued. Big Tech companies continue to be an enormous net positive for stakeholders by generating significant surplus to consumers, significant collective wealth for employees, significant corporate revenue growth and cash flows, and significant shareholder value.
The CEOs of Big Tech companies today control more economic resources than Presidents and Prime Ministers of several countries.
Internet scale businesses have been routinely under-estimated in the size of their total addressable markets (TAMs) by most investors. Internet scale businesses can expand their TAM across various sub-sectors and industries, continue to find specific niches to add value, and go nationwide and global in product distribution. As a result, we have the opinion that cloud software companies as a category continue to be significantly undervalued in the public equity markets, which presents a significant long-term buying opportunity from our perspective.

References:
"Koyfin | Advanced graphing and analytical tools for investors." https://app.koyfin.com/. Accessed 2 Aug. 2021.
"Ranked: The Biggest Companies in the World in 2021." 10 Jun. 2021, https://www.visualcapitalist.com/the-biggest-companies-in-the-world-in-2021/. Accessed 8 Aug. 2021.
"First Trust Dow Jones Internet ETF (FDN) Performance - ARCX ...." https://www.morningstar.com/etfs/arcx/fdn/performance. Accessed 15 Sept. 2021.
"Gross Domestic Product (GDP) | FRED | St. Louis Fed." https://fred.stlouisfed.org/series/GDP. Accessed 2 Aug. 2021.
"Key Metrics - FactSet." 16 Jul. 2021, https://www.factset.com/hubfs/Website/Resources%20Section/Research%20Desk/Earnings%20Insight/EarningsInsight_071621.pdf. Accessed 2 Aug. 2021.
"Top Ten Companies by Market Cap over 20 Years – Economic ...." 1 Nov. 2019, https://ercouncil.org/2019/top-ten-companies-by-market-cap-over-20-years/. Accessed 2 Aug. 2021.
"Jamin Ball on Twitter: "Data from Morgan Stanley CIO survey". 15 Jul. 2021. Accessed 2 Aug. 2021.
“Here’s What Happened on Every Minute of the Internet in 2020”. Visual Capitalist. 15 Sept. 2020. https://www.visualcapitalist.com/every-minute-internet-2020/. Accessed 9 Aug. 2021.
“The Cloud 100 Report: Where the Cloud is Headed in 2021”. Bessemer Venture Partners. 2 Aug. 2021. https://www.bvp.com/cloud100/where-the-cloud-is-headed-2021?from=feature. Accessed 10 Aug. 2010.
"Cloud Computing Fund - WisdomTree." https://www.wisdomtree.com/-/media/us-media-files/documents/resource-library/presentations/wisdomtree_wcld_presentation.pdf. Accessed 8 Aug. 2021.
This letter is not an offer to sell securities of any investment fund or a solicitation of offers to buy any such securities. An investment in any strategy, including the strategy described herein, involves a high degree of risk. Past performance of these strategies is not necessarily indicative of future results. There is the possibility of loss and all investment involves risk including the loss of principal.
Any projections, forecasts and estimates contained in this document are necessarily speculative in nature and are based upon certain assumptions. In addition, matters they describe are subject to known (and unknown) risks, uncertainties and other unpredictable factors, many of which are beyond Drawing Capital’s control. No representations or warranties are made as to the accuracy of such forward-looking statements. It can be expected that some or all of such forward-looking assumptions will not materialize or will vary significantly from actual results. Drawing Capital has no obligation to update, modify or amend this letter or to otherwise notify a reader thereof in the event that any matter stated herein, or any opinion, projection, forecast or estimate set forth herein, changes or subsequently becomes inaccurate.
This letter may not be reproduced in whole or in part without the express consent of Drawing Capital Group, LLC (“Drawing Capital”). The information in this letter was prepared by Drawing Capital and is believed by the Drawing Capital to be reliable and has been obtained from sources believed to be reliable. Drawing Capital makes no representation as to the accuracy or completeness of such information. Opinions, estimates and projections in this letter constitute the current judgment of Drawing Capital and are subject to change without notice.