Recently, we were invited to the opportunity to write about ETFs and index funds for Silicon Valley Investors Club, a global community of STEM professionals dedicated to making smarter investment and career decisions. We’ve formatted the post into this newsletter below, and you can view the original post here.
Overview
Today, we will cover how to invest in ETFs and index funds. It is always important to remember that the choices you make need to fall in line with your goals, objectives, and tolerance for risk. At the end of the day, the question you want to answer is, “what’s a simple way of getting started with investing?”
ETFs and index funds provide simple ways to invest in a basket of stocks that follow a specific industry or thesis. The primary reason to invest in them is to harness the returns of an idea without managing your own portfolio. An ideal investment framework is earning superior risk-adjusted returns with minimal cost and good tax efficiency.
Investors will often elect to use an ETF or index fund for one of the following reasons:
Time Commitment. Managing a portfolio takes a lot of time. Time for research, time for analysis, and time to execute and monitor trades. In many cases, those managing their own portfolio would often achieve better long-term results by delegating those responsibilities to a manager or simply mimicking an index through an index fund. In many cases, it is not that the investor lacks the brainpower, it is that they are spending their time on other things.
Experience & Knowledge. It may seem intuitive, but managing a portfolio of stocks, bonds, or both takes experience and knowledge. During the process of learning to invest, a popular route is to use broad-based index funds or target-date funds (funds based on a specific date that adjust allocation to become less volatile as that date approaches). There are many options here from companies like Vanguard, Charles Schwab, and Fidelity.
Interest In Financial Markets. At the end of the day, if you do not have the interest, it simply will not get done. Time and knowledge aside, if you do not have an interest in nurturing the portfolio to make sure that it stays aligned with your objectives, it can (and will) fall out of balance.
Selecting an ETF
This brings us to the heart of the post: picking an ETF that makes sense. When sifting through information online, there is a lot of noise. How do you separate fact from opinion and determine which fund is the best for your goals?
Each of the characteristics we will be discussing will display an example using the Vanguard Information Technology Index ETF (ticker symbol: VGT), found publicly on the Vanguard and Morningstar websites.
Key Considerations
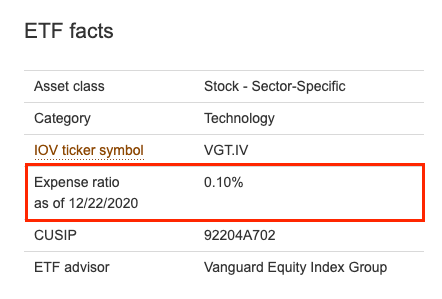
Expense Ratios
Expense ratios can range from 0.03% to 1.50% or more. Some ETFs that invest in scarce assets like crypto, global stocks, and private equities can charge higher amounts.
Higher costs are typically associated with international and emerging markets funds, specialized sectors or asset classes, and complex mechanics (i.e. leveraged products). A higher cost isn’t necessarily bad. It is simply the costs of operation being passed on to the investor, but still something to be cognizant of. Again, what is the net return-to-me?
As an example, we will use Vanguard’s Information Technology Index ETF (ticker symbol: VGT) as a sample fund to illustrate key considerations in the next few sections:
Liquidity
Liquidity is the availability of liquid assets to a market or company. A source of illiquidity may come from a fund holding thinly-traded stocks or complex instruments. An illiquid fund makes it difficult to sell your position at a fair price due to large spreads between the bid and the ask prices. Not enough buyers or demand resulting in illiquidity means you may have to sell your position at a discount.
Portfolio Distribution
How much an ETF invests in each asset is just as important as the assets themselves. For example, are the underlying stocks in a fund equally-weighted (all stocks in the fund have similar percentage weights) or top-heavy (top 10 stocks represent a large percentage of the total fund). A higher percentage weight in a high-performing stock is good for an equity ETF. Typically, each fund will list its top holdings and sometimes provide a link to all of the underlying assets. In many funds, the heaviest weighting is in the top 10 positions, and some funds can have an excess of 1,000 positions. In summary, know what you are buying and how much of it.
Net Asset Value (NAV)
NAV is the total value of the fund’s underlying assets. If the price on an exchange differs from this value, you may be buying the ETF at a premium, which can hurt you down the road. Buying these at a discount, however, would be preferable if the fund has nothing else wrong with it. For example, let’s consider the table below from Morningstar. The first and second rows highlight VGT’s price and VGT’s NAV; it’s good to see that there is minimal difference between the two because that implies that you are purchasing units of the fund for close to its market value.
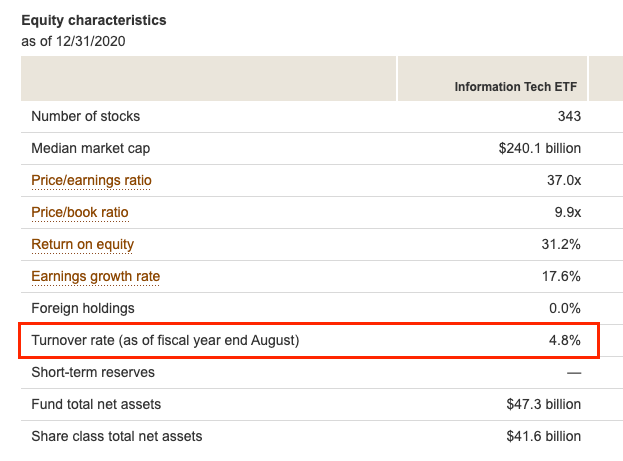
Rebalancing Cadence (“turnover”)
Portfolio rebalancing is the process of changing a portfolio’s investments and/or the portfolio’s percentage allocations to its investments. Some funds do not rebalance their portfolio until month-end. Other funds engage in rapid trading, thereby holding a stock for as little as a few weeks or even days, resulting in turnovers above 100%. These types of funds are typically more well-suited to a tax-advantaged retirement account like an IRA. Otherwise, you might end up with a surprising tax bill via capital gains distributions in the following year. In summary, portfolio turnover typically is inversely related to tax efficiency of an ETF: low portfolio turnover typically equates to high tax efficiency in ETFs.
Measuring Performance
Now that you have an understanding of the overview of an ETF, you should consider the quantitative factors to understand the risk/reward profile.
Risk Measurements
Alpha
Alpha measures the excess return compared to a benchmark such as the S&P 500. The higher the alpha the better. Data from S&P Global indicates that as of 6/30/2020, about 78% of large-cap US equity funds underperformed the S&P 500 Index over a 5-year time period. Reasons for the difficulty in achieving alpha include high fees, large fund sizes, lack of quality implementation of an investment strategy, the phenomenon of “closet indexing”, and an occasional fund preference for holding onto legacy blue-chip company names instead of investing in high-growth innovative companies.
Beta
Beta measures the volatility of a portfolio compared to an index or benchmark. The higher this is, the larger the price movements will be. Investors that desire less volatility in a portfolio typically choose a portfolio strategy with low beta. On the other hand, investors in high-beta funds typically desire to capture the upside volatility and high returns from a trending high-beta fund.
Upside and Downside Capture
Upside (downside) capture represents the participation of the portfolio in the upside (downside) moves of a benchmark index, such as the S&P 500 Index.
For example, an upside capture might be 110%, and a downside capture might be 80%. This means that the fund participated in 10% more upside growth than the benchmark and participated in 20% less of the downside risk. This helps to identify the total risk of the portfolio - on both good days and bad - for the fund relative to its chosen benchmark.
Growth-seeking investors typically desire an upside capture that is greater than 100%. Risk-averse and conservative investors that are worried about losses typically desire to minimize their downside capture and downside risk.
Risk-adjusted Return Measurements
Sharpe Ratio
Source: Investopedia
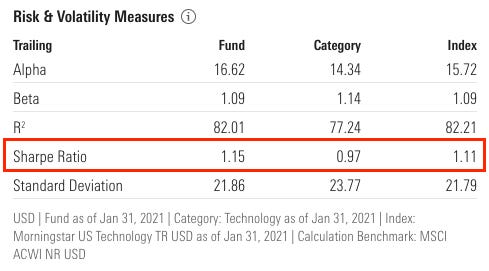
Sharpe Ratio measures the return of an investment relative to its risk. The higher this is, the better the investment’s risk-adjusted return. The reason for measuring Sharpe Ratio is to help navigate your portfolio returns versus its risk. Simply stated, are you earning a high return with low risk, or are you earning low returns with high risk? Good investors prefer the former over the latter, which implies that good investors have high Sharpe Ratios.
Treynor Ratio
Source: Investopedia
Similar to the Sharpe Ratio, the Treynor Ratio is another measure of risk-adjusted returns, in which a higher number is better. While the Sharpe Ratio utilizes standard deviation in its formula, the Treynor ratio substitutes beta for standard deviation. A key difference between the Sharpe and Treynor Ratios is that the Sharpe Ratio measures returns per unit of portfolio volatility, while the Treynor Ratio focuses on measuring returns per additional unit of market risk.
Note: the Treynor ratio was obtained from Yahoo Finance.
Examples of ETFs and Funds
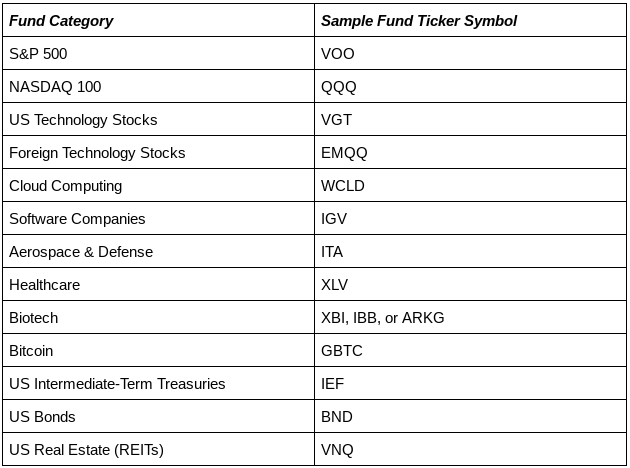
Here is a list of sample fund ticker symbols that help track specific themes:
Summary
The decision to self-manage your investments or delegate to a financial professional is often based on your time, knowledge, experience, and interest in financial markets. We hope that this summary on ETFs helps to expand your financial knowledge, demystify the complexity associated with choosing long-term investments, and improve investment outcomes.
If you are curious about learning more, please subscribe to Drawing Capital’s free weekly newsletter at drawingcapital.substack.com or email us at invest@drawingcapital.com. Drawing Capital is a private investment firm that invests in the “innovation economy”.
This letter is not an offer to sell securities of any investment fund or a solicitation of offers to buy any such securities. An investment in any strategy, including the strategy described herein, involves a high degree of risk. Past performance of these strategies is not necessarily indicative of future results. There is the possibility of loss and all investment involves risk including the loss of principal.
Any projections, forecasts and estimates contained in this document are necessarily speculative in nature and are based upon certain assumptions. In addition, matters they describe are subject to known (and unknown) risks, uncertainties and other unpredictable factors, many of which are beyond Drawing Capital’s control. No representations or warranties are made as to the accuracy of such forward-looking statements. It can be expected that some or all of such forward-looking assumptions will not materialize or will vary significantly from actual results. Drawing Capital has no obligation to update, modify or amend this letter or to otherwise notify a reader thereof in the event that any matter stated herein, or any opinion, projection, forecast or estimate set forth herein, changes or subsequently becomes inaccurate.
This letter may not be reproduced in whole or in part without the express consent of Drawing Capital Group, LLC (“Drawing Capital”). The information in this letter was prepared by Drawing Capital and is believed by the Drawing Capital to be reliable and has been obtained from sources believed to be reliable. Drawing Capital makes no representation as to the accuracy or completeness of such information. Opinions, estimates and projections in this letter constitute the current judgment of Drawing Capital and are subject to change without notice.


