


Healthcare: Outcomes for Patients and Patient Investing
Weekly updates on the innovation economy and market commentary.

Today’s Drawing Capital newsletter discusses a high-level overview of investment opportunities in healthcare. For a more detailed discussion about visualizing the American healthcare industry and an introduction to healthcare technology (“healthtech”), please view the following 3 blog posts that were previously published by Drawing Capital:
“Visualizing the American Healthcare Industry”:

“Introduction to Healthtech”:
“Healthtech: Why Now?”:
Healthcare is a Large and Growing Industry

Key Insights: The market size of healthcare is large and growing. According to Centers for Medicare & Medicaid Services (CMS), American healthcare spending reached about $4.1 trillion in 2020, marking a 9.7% increase from 2019. Additionally, American healthcare spending in 2020 was about one-fifth of America’s GDP in 2020.
5 Opinions on Innovation Investing
Innovation and transformative technology take time to develop, market, and scale over time.
Solving big problems can lead to big value creation for society and big financial gains.
Innovation investing follows power law distributions and is a form of “positive asymmetry investing”. One method of identifying this trait is via the following phrase, “this may not work, but if it does, the outcome could be huge”.
Innovation investing requires acceptance of ambiguity and uncertainty in outcomes. It's tough to answer, "how big can this opportunity possibly be?" when investing in the early stages. In some cases, investors have a negative connotation of surprises, especially negative surprises when something doesn’t meet their expectations. On the flip side, positive surprises can and do exist, particularly in certain biopharma and healthtech technologies or acquisitions.
For example of a positive surprise: Gilead acquired a clinical-stage called Pharmasset for about $11 billion in 2011, primarily for hepatitis C treatments. At the time, some viewed this acquisition as large and risky, especially considering that Pharmasset generated less than $1 million in revenue in 2011. Fast forward a few years after 2011, and Gilead reported over $32 billion in revenue and over $18 billion in net income in fiscal year 2015, primarily driven from revenues from Gilead’s hepatitis C treatments.
Ambiguity and uncertainty in outcomes leads to price volatility. In Apple’s case and despite the splendid historical stock performance, Apple’s stock price has experienced multiple 10%+ price drawdowns from peak prices in the past decade, thereby implying the fact that stock price charts of innovative companies are rarely “up and to the right at all times”. Innovation investing unfortunately suffers from higher price volatility through a variety of causes:
Risk-off sentiment and negative macroeconomic sentiment can cause investors to decrease time horizons and re-allocate more money away from risky/unknown/uncertain investments and towards assets that are more considered to have "known payoffs & return distributions".
Risk-off sentiment reduces price multiples, while risk-on liquidity-fueled rallies can cause surges in price multiples (valuations).
Real innovation is transformative, not incremental, thereby creating the potential for exponential growth. The development of innovative technologies can experience setbacks along the innovation journey, which contributes to price volatility because setbacks increase uncertainty, and investors typically dislike uncertainty and favor certainty.
Healthcare Technology: “Healthtech”
The Healthtech Equation: Improved Patient Outcomes + Technology + Commercial Opportunity

The key takeaway is that the intersection and convergence of these three traits can create favorable outcomes for both patients and shareholders.
Big Trends in Healthtech

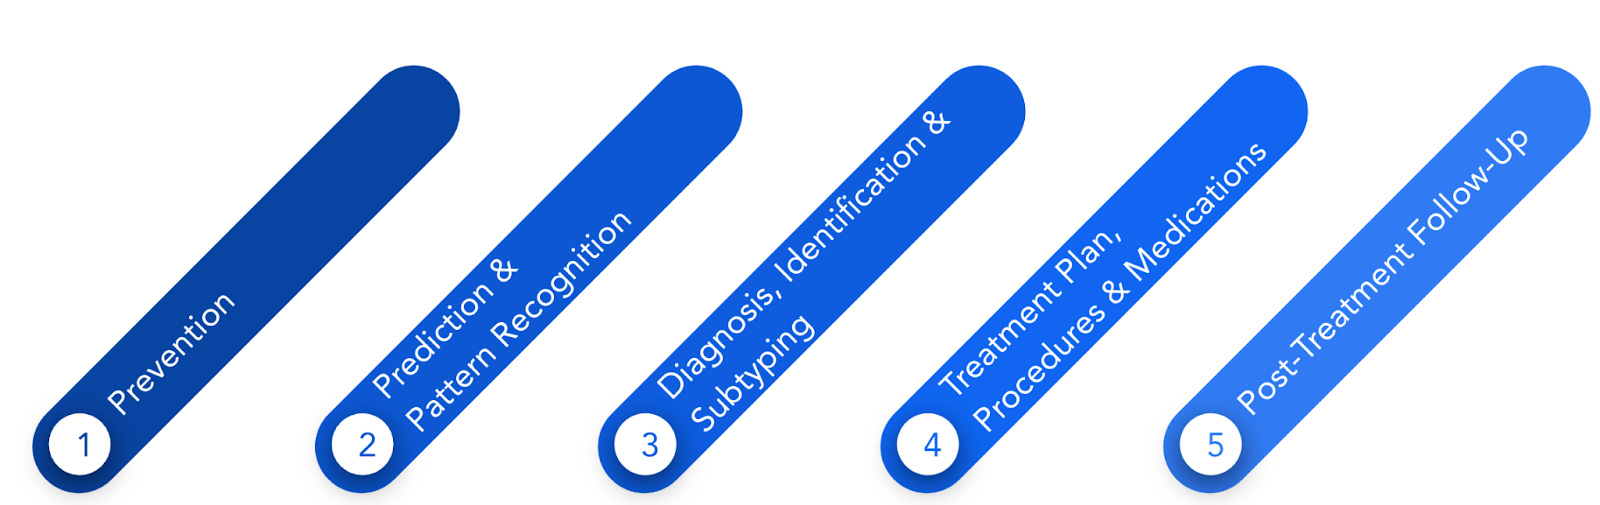
Healthtech and the “Patient Journey”
As displayed in the following illustration below, healthtech has applications for improving patient outcomes and value creation across the five steps in the “patient journey”. The key takeaway is that healthtech improves the “patient journey” in health and medicine.
Overall, the convergence of a desire for improved patient outcomes, technology, and commercial opportunities creates an attractive and innovative environment for healthtech. The intersection of data science models, capital, higher quality & larger datasets, data standardization, and scientific advancement is creating the next innovation wave in healthtech, which could lead to long-term returns for patient healthtech investors and improvements in patient outcomes.
Identifying Exponential Growth Opportunities
The High Growth Triangle Framework

The “High Growth Triangle” is a high-level framework in the innovation economy for assessing companies that may experience exponential growth via the intersection of a technological inflection point, exceptional leadership, and unusual circumstance. The High Growth Triangle visualizes the connection between these 3 traits in an effort to provide a high-level qualitative investment framework.
10 Themes for Identifying Exponential Growth Opportunities

The above illustration highlights ten themes that are commonly found as a framework for seeking potential exponential growth investment opportunities. We derived these ten themes after analyzing previous industry research and noticing commonalities in specific traits in companies that have more than 5x’d or 10x’d their stock price over the past decade.
Of course, a disclosure or disclaimer note is important in that while exponential growth opportunities are nice to earn, there are no guarantees in investing, and many high-growth opportunities often come with higher price fluctuation and volatility as a package deal. At the same time, simply seeking high-risk investments does not necessarily imply a high return-producing investment, and future returns can vary when compared to historical performance. Therefore, adding volatility to a portfolio increases the likelihood of a wider distribution of outcomes.
M&A Deal Premiums for American Biopharma Companies

This chart illustrates the acquisition price premiums for mergers and acquisition deals for American biopharma companies. High M&A price premiums can generate significant returns to shareholders of the target companies. Visualizing the data from HBM Partners and Statista, there has been a 66% average M&A premium paid from 2010 to 2019 for American public biopharma companies. In this analysis, the M&A premium is defined as the increase of the stock price on the day of deal announcement; M&A deal sizes less than $100 million were excluded.
Data on Biotech IPOs

Sourced from Professor Jay Ritter’s research on IPOs, there are 4 notable data points for biotech IPOs since 1980. Among these 4 selected data points, one may have differing perspectives on enthusiasm and risk. For example, across the 1000+ biotech IPOs, the weighted-average one-day return from biotech IPO investing over the past 4 decades was about 15%, which is nice, although a risk factor is that more than one-third of biotech IPOs were for biotech companies without any significant revenue sources in the trailing year leading up to the IPO.
Measuring Momentum in Healthcare Stocks & Healthcare Funds

The illustration above highlights four notable input variables, among others, for measuring momentum in healthcare stocks and healthcare-specific funds.
Sample Healthcare Funds & Ticker Symbols

From an ETF fund perspective, these eight ETFs are sample funds in gaining equity exposure to US healthcare. XLV and PSCH, which are highlighted in the purple boxes, are broader healthcare ETFs with differentiating weights based on market cap (large-cap vs. small cap), while the remaining ETFs focus on specific industries within the healthcare sector.

The above chart tracks the historical performance of the 8 healthcare-focused ETFs mentioned on the previous illustration, with the data and chart illustration sourced from Koyfin.
Key Insights:
Significant variations in performance returns have occurred across a range of ETFs in the healthcare industry in the past 7 years.
As of October 14, 2022, these 8 ETFs historically created positive long-term results for investors in the measured trailing 7-year time period, although the volatility in price movements is also noteworthy and potentially a cautionary tale.
XBI and IBB (biotech-focused ETFs) experienced compounded annualized returns below 4% in the measured 7-year time period, which were lower returns than the remaining 6 other healthcare-focused ETFs in this specified peer group and time period.
In terms of investment performance, the IHI ETF (as a proxy for a group of medical device company stocks) was the leader in the group in this measured 7-year time period. For the trailing 7-year time period ending on October 14, 2022, the IHI ETF delivered a nearly 14% compounded annualized growth rate and a nearly 150% cumulative return.
Conclusion
In summary, today’s newsletter by Drawing Capital discusses a high-level overview of investment opportunities in healthcare, investment frameworks for the innovation economy, the intersection of patient outcomes & technology & commercial opportunities, and more:
The market size for American healthcare is large and growing. Rising costs of healthcare makes healthcare more expensive. Despite the large market size for healthcare, there are a number of issues and opportunities for improvement in healthcare spending efficiency and patient outcomes.
Among many insights, the overall key takeaway is that there are several opportunities for improvement in the healthcare sector across a variety of channels, such as improvement in patient outcomes, cost efficiency, pharma drug pricing, and more. As a result, risk reduction and value generation can lead to market cap creation.
Given the significant issues and opportunities for improvement in healthcare efficiency, the patient journey, and patient outcomes, healthtech and computational biology can address healthcare issues and improve healthcare outcomes.
The creation of win-win situations by improving patient outcomes and investor returns is valuable.
It will be increasingly valuable to patients and the overall healthcare ecosystem when innovations, discoveries, and scientific advancements can improve patient outcomes, decrease costs, enable faster time-to-market, and provide greater transparency.
Investors have a wide variety of methods of investing in the healthcare industry, including in publicly-traded individual companies, various healthcare funds, and investments in private markets (such as making individual startup company investments or via venture capital funds). Historically, long-term investments in several healthcare funds have both experienced price volatility and produced positive results to shareholders.

References:
Centers for Medicare & Medicaid Services (CMS), https://www.cms.gov/Research-Statistics-Data-and-Systems/Statistics-Trends-and-Reports/NationalHealthExpendData/NationalHealthAccountsHistorical
Koyfin, https://www.koyfin.com/
Gilead Sciences to Acquire Pharmasset, Inc. for $11 Billion, 11/21/2011, https://www.gilead.com/news-and-press/press-room/press-releases/2011/11/gilead-sciences-to-acquire-pharmasset-inc-for-11-billion
Gilead Sciences Announces Fourth Quarter and Full Year 2015 Financial Results, 2/2/2016, https://www.gilead.com/news-and-press/press-room/press-releases/2016/2/gilead-sciences-announces-fourth-quarter-and-full-year-2015-financial-results
IPO Statistics from Professor Jay Ritter, https://site.warrington.ufl.edu/ritter/files/IPO-Statistics.pdf
“Average Premiums Paid in Public Biopharma M&A Deals from 2010 to 2019”, Statista, https://www.statista.com/statistics/1093439/biopharma-company-trade-sales-premiums-us/
“HBM Pharma/Biotech M&A Report 2020” by HBM Partners, February 2020, https://www.hbmpartners.com/media/docs/industry-reports/HBM-Pharma-Biotech-M-A-Report-2020.pdf
This letter is not an offer to sell securities of any investment fund or a solicitation of offers to buy any such securities. Any stock, options or futures symbols, companies or investment products displayed are for illustrative purposes only and are not intended to portray recommendations. An investment in any strategy, including the strategy described herein, involves a high degree of risk. Past performance of these strategies is not necessarily indicative of future results. There is the possibility of loss and all investment involves risk including the loss of principal.
Any projections, forecasts and estimates contained in this document are necessarily speculative in nature and are based upon certain assumptions. In addition, matters they describe are subject to known (and unknown) risks, uncertainties and other unpredictable factors, many of which are beyond Drawing Capital’s control. No representations or warranties are made as to the accuracy of such forward-looking statements. It can be expected that some or all of such forward-looking assumptions will not materialize or will vary significantly from actual results. Drawing Capital has no obligation to update, modify or amend this letter or to otherwise notify a reader thereof in the event that any matter stated herein, or any opinion, projection, forecast or estimate set forth herein, changes or subsequently becomes inaccurate.
This letter may not be reproduced in whole or in part without the express consent of Drawing Capital Group, LLC (“Drawing Capital”). The information in this letter was prepared by Drawing Capital and is believed by the Drawing Capital to be reliable and has been obtained from sources believed to be reliable. Drawing Capital makes no representation as to the accuracy or completeness of such information. Opinions, estimates and projections in this letter constitute the current judgment of Drawing Capital and are subject to change without notice.