


Introduction
There are 2 popular styles of investing: investing for growth and investing for recurring return. Each investor has their own personal investing style, preference, goals, time horizon, and risk profile. At Drawing Capital, we have an investing approach that focuses on high-growth technology-enabled companies in the “innovation economy”, with a significant emphasis on software and biotech companies. In this newsletter, we explore the following 3 topics:
Leveraged growth investing and related topics, examples, and margin loan data
Opportunity costs and direct costs in investing
Historical NASDAQ returns
Interest Rates and Portfolio Leverage
Low interest rates incentivize speculation and investments into “risk assets”, especially when investors seek high returns. “Risk-free assets” are academically credit risk-free from a default risk perspective, and “risk assets” are assets that have a possibility of principal loss on investment. When the yields on US Treasury bonds, CDs, and savings accounts are both low and below inflation rates, investors will place more emphasis on investments that produce positive inflation-adjusted returns as mechanisms for both a store of value and to grow wealth over time.
Low interest rates incentivize borrowing via the use of financial leverage. When the Federal Reserve lowers interest rates, this scenario increases the buying power for individuals in purchasing houses and stocks. When the cost of borrowing is only 1-3%, the temptation to use borrowed money to increase return on equity increases, especially when there is high predictability of stable or increasing future cash flows. In some instances, the tax code also incentivizes debt financing, as seen through mortgage interest tax deductions and interest deductibility for corporations.
Leverage is your friend when you use it with prudence, and one should seek to mitigate levered losses. “Leveraged long while the music is on” is a valuable investing phrase when correctly navigating market cycles.
In an effort to reinforce this knowledge, let’s visualize 3 scenarios:
Scenario 1:
You have a $10,000 portfolio that is currently all in cash, and then you buy $10,000 worth of stocks. Since the amount of stock that you purchased does not exceed your cash balance, you did not incur a margin loan. Let’s suppose that over the course of the year, these stocks collectively gained 10%. At the end of the year, these calculations would be applicable for your portfolio return:
Portfolio Asset Value: 10% return on a $10,000 starting value = $11,000 ending asset value
Margin Loan Balance: $0 loan balance
Margin Loan Interest: $0
Portfolio Equity Value = Portfolio Asset Value - Margin Loan Balance - Margin Loan Interest = $11,000 - $0 - $0 = 11,000.
Portfolio Return in Scenario 1: (Ending Portfolio Value - Beginning Portfolio Value) / Beginning Portfolio Value = ($11,000 - $10,000) / (10,000) = 10%
In Scenario 1, you earned a 10% return on your $10,000 beginning portfolio value.
Scenario 2:
You have a $10,000 portfolio that is currently all in cash, and then you use 2x leverage and buy $20,000 worth of stock. Let’s suppose that over the course of the year, these stocks collectively lost 10% in price. At the end of the year, these calculations would be applicable for your portfolio return:
Portfolio Asset Value: -10% return on a $20,000 starting value = $18,000 ending asset value
Margin Loan Balance: $10,000 loan balance
Margin Loan Interest: 3% annual interest on $10,000 margin loan balance = $300 margin loan interest
Portfolio Equity Value = Portfolio Asset Value - Margin Loan Balance - Margin Loan Interest = $18,000 - $10,000 - $300 = $7,700.
Portfolio Return in Scenario 2: (Ending Portfolio Value - Beginning Portfolio Value) / Beginning Portfolio Value = ($7,700 - $10,000) / ($10,000) = -23%
In Scenario 2, you generated an unpleasant -23% return on your $10,000 beginning portfolio value.
Scenario 3:
You have a $10,000 portfolio that is currently all in cash, and then you use 2x leverage and buy $20,000 worth of stocks. Because you only started with $10,000 in cash, let’s presume that you borrowed another $10,000 via a 3% margin loan to finance the total $20,000 stock purchase. Let’s suppose that over the course of the year, these stocks collectively gained 10%. At the end of the year, these calculations would be applicable for your portfolio return:
Portfolio Asset Value: 10% return on a $20,000 starting value = $22,000 ending asset value
Margin Loan Balance: $10,000 loan balance
Margin Loan Interest: 3% annual interest on $10,000 margin loan balance = $300 margin loan interest
Portfolio Equity Value = Portfolio Asset Value - Margin Loan Balance - Margin Loan Interest = $22,000 - $10,000 - $300 = 11,700.
Portfolio Return in Scenario 3: (Ending Portfolio Value - Beginning Portfolio Value) / Beginning Portfolio Value = ($11,700 - $10,000) / (10,000) = 17%
In Scenario 3, you earned a 17% return on your $10,000 beginning portfolio value.
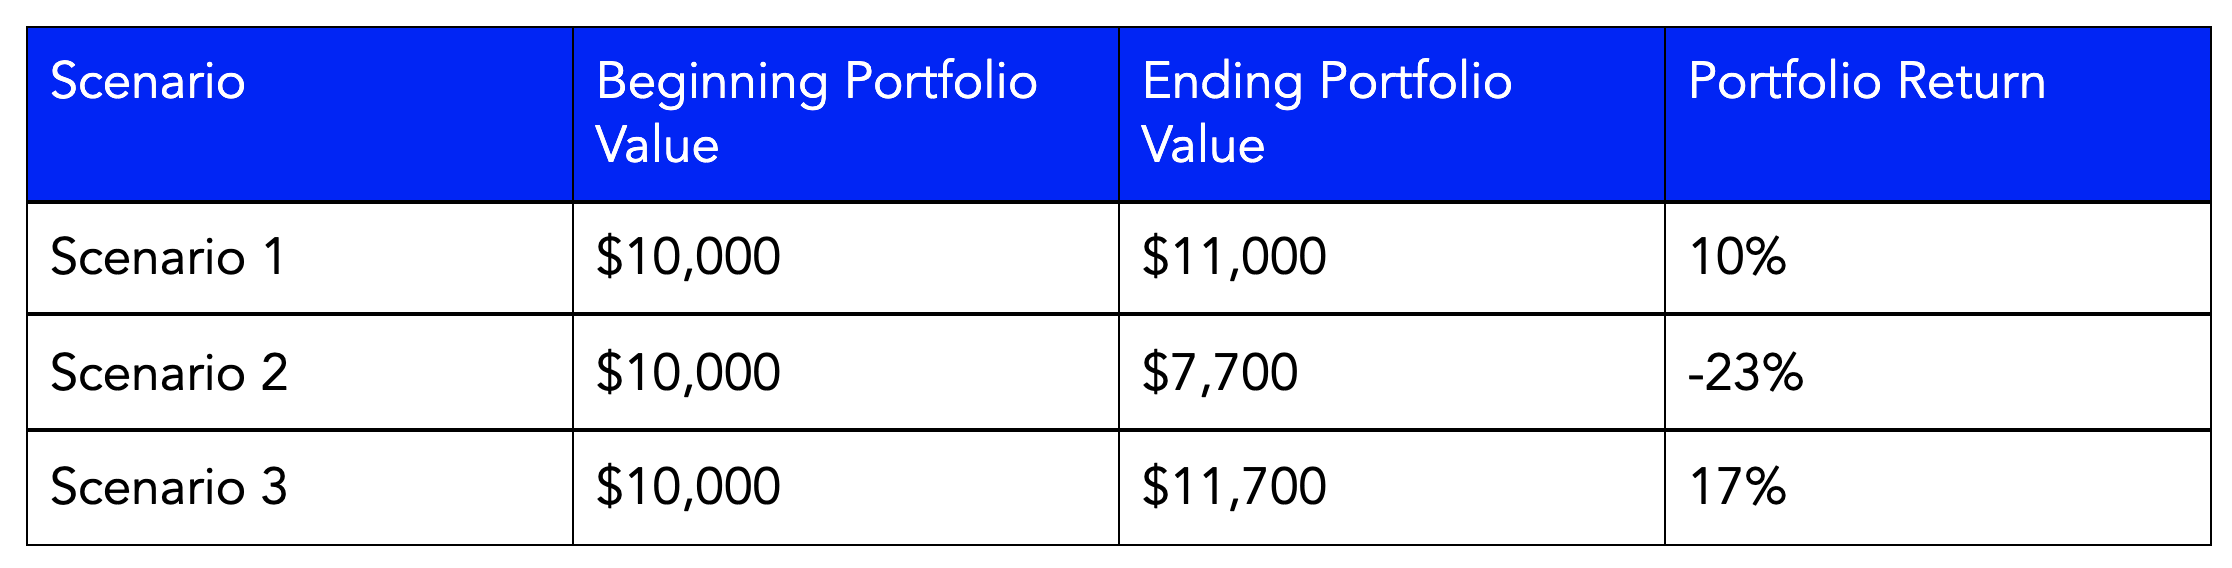
When positive returns occur that exceed the costs of leverage, returns are amplified, as seen by Scenario 3’s returns exceeding Scenario 1’s returns.
2 Common Costs in Investing:
Direct Investing Costs:
There are direct costs in investing, such as brokerage fees and commissions, data licensing fees, fund management fees, operating expense ratios for ETFs and mutual funds, research newsletter subscriptions, the costs to file tax forms that are related to investing, and more.
Opportunity Costs:
Opportunity cost is the potential value given up by choosing another alternative. While accounting costs focus on direct expenses, economic costs include both direct expenses and implicit opportunity costs. Opportunity cost can be thought of as a “cost of capital” investing approach. As your opportunity cost decreases, your aperture and willingness for making more investments would typically increase.
For example, when a Treasury bill or CD pays less than 1%, then your opportunity cost of forgoing this little yield is low, which incentivizes more investors to pursue other investment opportunities. On the other hand, if an investor has access to an investment fund that consistently generates 25% in annualized returns, then an investor rationally would have a preference of investing in this investment fund unless the investor can find an even better investment opportunity that can generate more than 25% in annualized returns.
Example of Leveraged Tech Investing
Over the past decade, the $TQQQ fund (a leveraged NASDAQ 100 Index fund) has generated significant positive returns with significant outperformance over the $QQQ ETF (an index fund that seeks to track the NASDAQ 100 Index).
The chart below displays the calendar year performances for the $TQQQ fund and the $QQQ fund in a comparative method:

From 2011-2020, there were 4 instances in which the $TQQQ fund more than doubled in a calendar year. These years were 2013, 2017, 2019, and 2020.
Leveraged funds have increased risk profiles, are considered to be complex instruments, can exhibit tracking error and beta slippage, and are not suitable for many investors.
When managed correctly and appropriately over the past decade, leveraged growth investing in technology companies was very lucrative. According to Morningstar data, $QQQ has enjoyed a ~20% CAGR over the past 10 years, while $TQQQ generated a whopping ~55% CAGR over the past 10 years. A 20% CAGR over 10 years implies transforming $1 into ~$6. A 55% CAGR over 10 years implies transforming $1 into $80. CAGR = compounded annual growth rate.
Margin Loan Data

Data from FINRA demonstrates that margin debit balances have more than doubled since January 2013. Despite the known risks associated with buying investments via debt financing, the combination of low interest rates and rising financial asset prices incentivizes some investors to increase their utilization of margin debt financing, suggesting that the trend of leveraged growth investing has spiked since January 2020.
8 Notes on Portfolio Risk Management
Contrary to many investment strategies, wealth managers, and academic literature, the purpose of investing is not to overly diversify a portfolio by blindly buying tens of thousands of securities just for the sake of “portfolio diversification”. At Drawing Capital, we have the opinion that investing is focused on 2 core traits: reduce the probability of permanent long-term capital loss and generate competitive returns for investors.
The purpose of diversification is to reduce the risk of exaggerated drawdowns while maintaining favorable and positive returns. Also, the purpose of diversification is not to compose a portfolio of low-returning assets with high-returning assets. An investor can maintain a diversified portfolio of high-return-potential assets if the individual holdings in the portfolio have a low or inverse correlation to one another.
Investors can help companies reduce or eliminate risks with talent, time, and money. Good investors are in the “risk reduction” business. Exceptional investors are in the “risk elimination” business, whereby the probability of permanent capital impairment is small.
By definition, risk is the probability of loss. Hazards increase risk, and a peril causes a risk to occur. Importantly, risk is not the loss itself. The magnitude of the loss measures how large a loss has become, either in dollar terms or percentage terms.
Financial leverage magnifies gains and magnifies losses. In positive-trending markets, leverage works wonders, but being levered long on the downside can be particularly painful.
In the continued search for high returns in a low-interest rate world, the use of financial leverage has become commonplace for many hedge funds, private equity funds, sophisticated investors, and family offices in an effort to magnify winnings.
Whenever borrowed money is used to finance the acquisition of investments or complex non-retail-oriented investment products, there is additional risk and hurdle rates in the investment decision-making process.
Buying from dis-economic sellers, distressed sellers, and sellers that believe that technological innovation is a short-term transient phenomena can present a significant investment opportunity for patient and knowledgeable investors.
Summary
Understanding the differences between investing for growth versus investing for recurring returns is helpful in developing a better investment framework when managing a portfolio. Historical data suggests that leveraged growth investing, particularly when “being leveraged long while the music is on” in navigating market cycles, generated significant returns to investors. By understanding both the merits and downsides associated with financial leverage and the opportunity costs of investing as opposed to simply looking at a binary outcome of “will this investment go up or down in price”, the investor has improved sophistication and knowledge, which thereby is helpful in potentially generating higher returns, managing downside risks, and improving financial outcomes.

References:
"ProShares UltraPro QQQ (TQQQ) Performance - XNAS | Morningstar." https://www.morningstar.com/etfs/xnas/tqqq/performance. Accessed 27 Jun. 2021.
This letter is not an offer to sell securities of any investment fund or a solicitation of offers to buy any such securities. An investment in any strategy, including the strategy described herein, involves a high degree of risk. Past performance of these strategies is not necessarily indicative of future results. There is the possibility of loss and all investment involves risk including the loss of principal.
Any projections, forecasts and estimates contained in this document are necessarily speculative in nature and are based upon certain assumptions. In addition, matters they describe are subject to known (and unknown) risks, uncertainties and other unpredictable factors, many of which are beyond Drawing Capital’s control. No representations or warranties are made as to the accuracy of such forward-looking statements. It can be expected that some or all of such forward-looking assumptions will not materialize or will vary significantly from actual results. Drawing Capital has no obligation to update, modify or amend this letter or to otherwise notify a reader thereof in the event that any matter stated herein, or any opinion, projection, forecast or estimate set forth herein, changes or subsequently becomes inaccurate.
This letter may not be reproduced in whole or in part without the express consent of Drawing Capital Group, LLC (“Drawing Capital”). The information in this letter was prepared by Drawing Capital and is believed by the Drawing Capital to be reliable and has been obtained from sources believed to be reliable. Drawing Capital makes no representation as to the accuracy or completeness of such information. Opinions, estimates and projections in this letter constitute the current judgment of Drawing Capital and are subject to change without notice.