Introduction
Today’s newsletter provides a series of charts to help illustrate a market overview and update. Specifically, this newsletter focuses on the following:
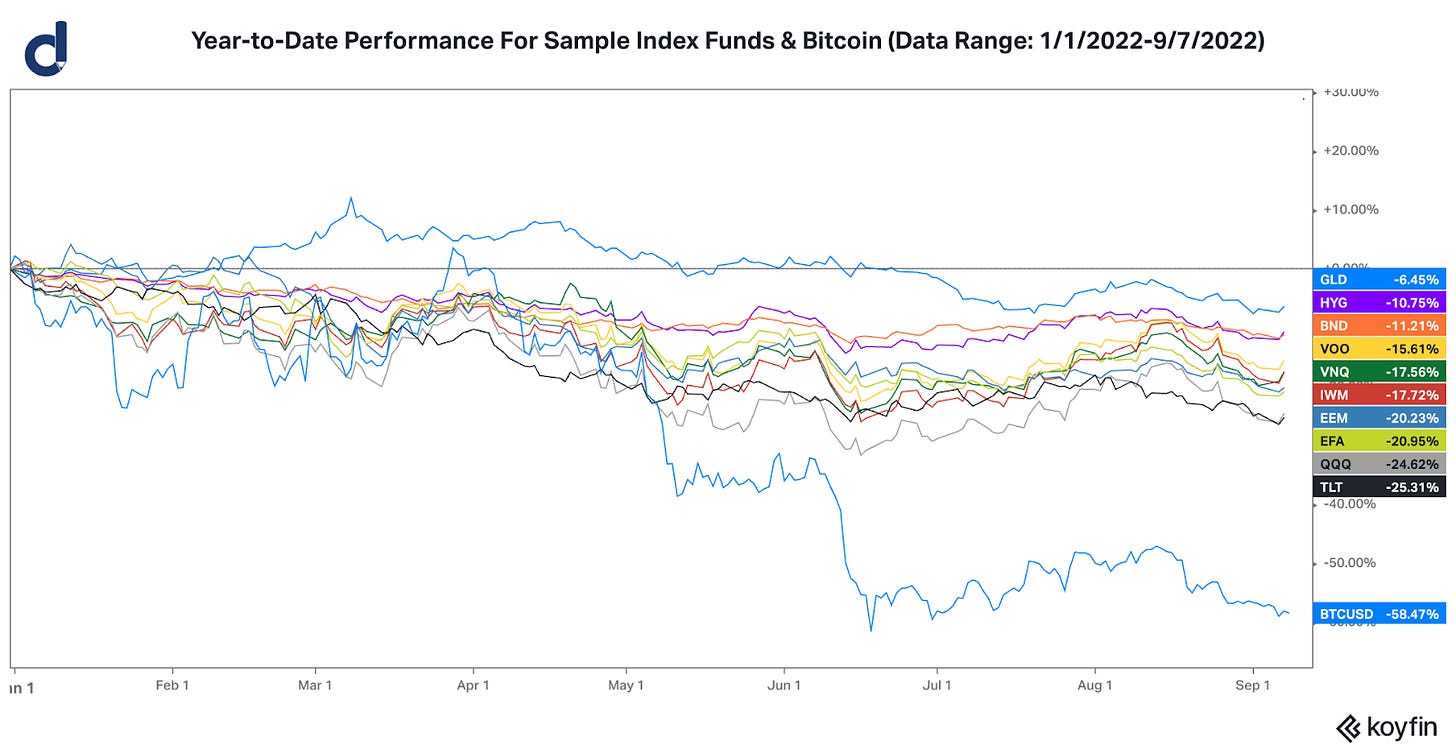
Price declines, drawdowns, and year-to-date performance returns across a range of financial markets
Market volatility and volatility indices
Inflation and rising interest rates
Price Declines, Drawdowns, and YTD Performance Across Asset Classes
Across many asset classes in financial markets, there have been significant drawdowns and losses in 2022 thus far, providing few tailwinds for optimistic investors in financial markets.
The chart below displays the percentage drawdowns from prior local peak prices of various popular index funds in various asset classes. Notably, this sample series of popular index funds are all currently facing double-digit percentage drawdowns.
The following table below provides the corresponding asset class that is linked to the sample index fund ticker symbol from the above 2 charts.
Market Volatility
The chart below highlights that higher volatility often coincides with larger percentage drawdowns.
Elevated levels of volatility imply greater price fluctuations, greater investor uncertainty, and a higher cost of hedging via elevated option premiums that incorporate vega (volatility component in option pricing).
Historically over the past 20 years, correlations exist between both the index volatilities and percentage drawdowns for popular stock market indices, such as the S&P 500 Index (SPX), NASDAQ 100 Index (NDX), and Russell 2000 Index (RTY).
Historically, large upward spikes in volatility indices coincide with large percentage drawdowns. Examples include Q4 2008, Q4 2018, and March 2020.
According to volatility index data from the Federal Reserve Economic Database:
From 12/31/2021 to 9/1/2022, the CBOE S&P 500 Volatility Index (VIXCLS) rose from 17.22 to 25.56.
From 12/31/2021 to 9/1/2022, the CBOE NASDAQ 100 Volatility Index (VXNCLS) rose from 21.20 to 32.26.
From 12/31/2021 to 9/1/2022, the CBOE Russell 2000 Volatility Index (RVXCLS) rose from 23.59 to 30.09.
Key Insight: Price fluctuations have and will continue to occur, especially with the ongoing geopolitical tensions, tightening monetary policy, and consumer concerns with inflation and specific commodity prices (such as oil and gasoline prices), and other factors. Historically, price fluctuations (which sometimes occur in a jarring manner) will contribute to both market volatility in the short-term and potential investment opportunities in the long-term.
Inflation and Rising Interest Rates
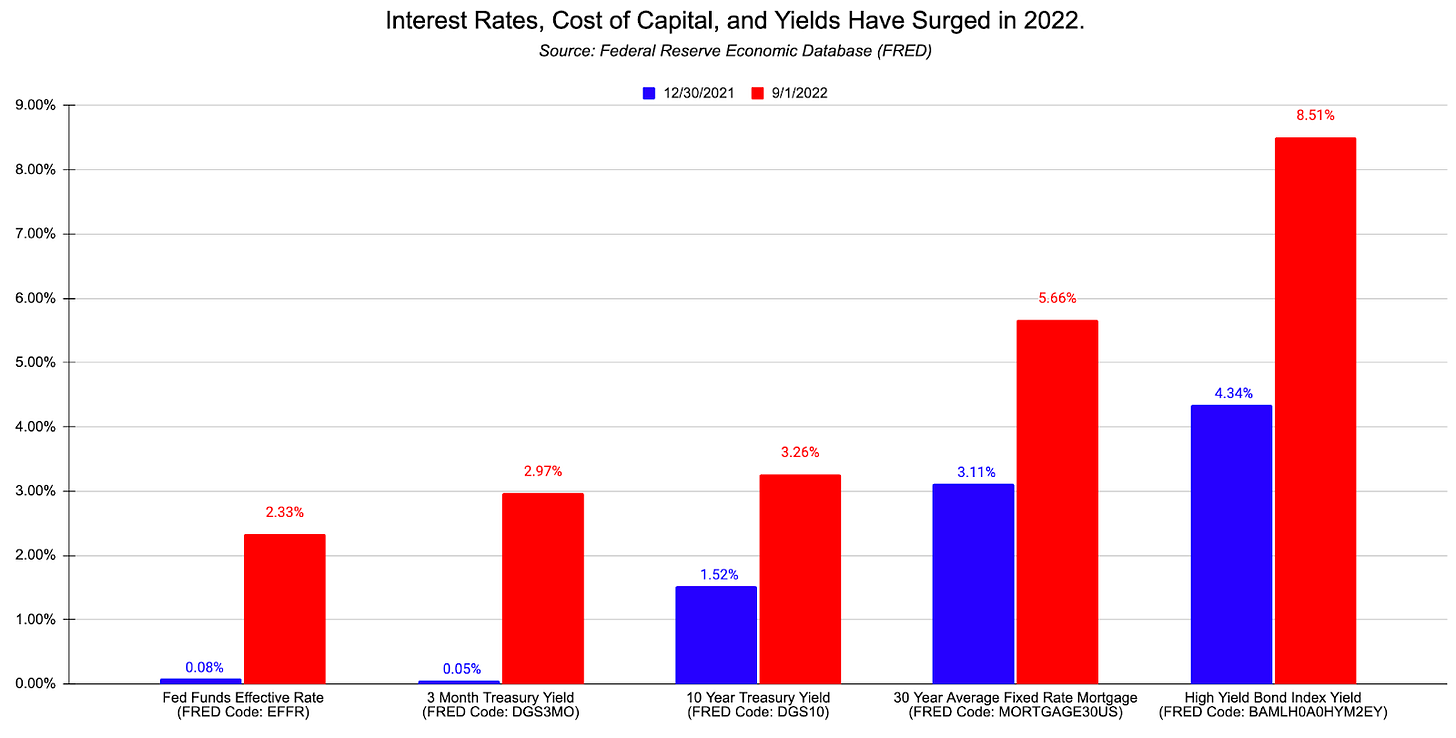
Inflation is certainly among the most trending words in macroeconomics and markets over the past year. Since June 2021, the year-over-year monthly CPI inflation rates have exceeded 5%. Elevated inflation rates have caused the Federal Reserve and other central banks around the world to implement a tightening monetary policy with rising interest rates. In particular, the Federal Reserve (via the Federal Open Market Committee) sets the target range for the Fed Funds interest rate, which is the overnight interbank lending rate.
As seen by the chart below, interest rates and the cost of borrowing have sharply risen over the past 8 months for the federal government, banks, corporate debt, and mortgage rates for new homebuyers.
Key Insights:
Tightening monetary policy, rising interest rates, and rising discount rates contribute to lower affordability, accessibility, availability, and abundance of investment capital that’s interested in speculative assets, long-duration assets, and risk assets. Rising cost of capital can negatively impact both price multiples and prices of risk assets.
Rising interest rates increase the cost of borrowing. For new homebuyers, rising mortgage interest rates can reduce purchasing power (affordability) and can increase the monthly mortgage payment. For example, for a $500K mortgage loan on a 30-year fixed rate mortgage, a significant difference in the monthly mortgage payment exists between a 6% mortgage interest rate and a 3% mortgage interest rate:
A 6% interest rate for a 30-year fixed rate $500K mortgage implies a nearly $3000 monthly mortgage payment.
A 3% interest rate for a 30-year fixed rate $500K mortgage implies a nearly $2100 monthly mortgage payment.
In this hypothetical example, a jump in mortgage rates from 3% to 6% increased the monthly mortgage payment by about $900 per month, or nearly 42%.
Driven by the combination of elevated inflation rates, tightening monetary policy, rising probabilities of an economic recession in the near future, negative investor sentiment, and ongoing geopolitical tensions, the net result is that there is less availability, accessibility, and affordability for capital (especially speculative capital and capital investments that’s interested in “innovation stocks” & long duration assets). When there is significant selling pressure in these categories without large buyers stepping in with a willingness to buy at higher prices, then prices can experience significant volatility and may potentially face large price declines.
Rising interest rates can coincide with rising discount rates. Without an increase in future cash flows, the present value of future cash flows (particularly for long duration assets with uncertain future cash flows) mathematically decreases with rising discount rates.
Summary
In summary and as a market update, this series of charts and commentary focused on the following topics:
Price declines, drawdowns, and year-to-date performance returns across a range of financial markets
Market volatility and volatility indices
Inflation and rising interest rates
References:
Koyfin, https://www.koyfin.com/home
Federal Reserve Economic Database (FRED), https://fred.stlouisfed.org/
CPI Inflation Data from US Bureau of Labor Statistics, https://www.bls.gov/cpi/
Effective Federal Funds Rate Data from the Federal Reserve Bank of New York, https://www.newyorkfed.org/markets/reference-rates/effr
CBOE S&P 500 VIX Volatility Index Data from Federal Reserve Economic Database (FRED), https://fred.stlouisfed.org/series/VIXCLS
CBOE NASDAQ 100 Volatility Index Data from Federal Reserve Economic Database (FRED), https://fred.stlouisfed.org/series/VXNCLS
CBOE Russell 2000 Volatility Index Data from Federal Reserve Economic Database (FRED), https://fred.stlouisfed.org/series/RVXCLS
This letter is not an offer to sell securities of any investment fund or a solicitation of offers to buy any such securities. An investment in any strategy, including the strategy described herein, involves a high degree of risk. Past performance of these strategies is not necessarily indicative of future results. There is the possibility of loss and all investment involves risk including the loss of principal.
Any projections, forecasts and estimates contained in this document are necessarily speculative in nature and are based upon certain assumptions. In addition, matters they describe are subject to known (and unknown) risks, uncertainties and other unpredictable factors, many of which are beyond Drawing Capital’s control. No representations or warranties are made as to the accuracy of such forward-looking statements. It can be expected that some or all of such forward-looking assumptions will not materialize or will vary significantly from actual results. Drawing Capital has no obligation to update, modify or amend this letter or to otherwise notify a reader thereof in the event that any matter stated herein, or any opinion, projection, forecast or estimate set forth herein, changes or subsequently becomes inaccurate.
This letter may not be reproduced in whole or in part without the express consent of Drawing Capital Group, LLC (“Drawing Capital”). The information in this letter was prepared by Drawing Capital and is believed by the Drawing Capital to be reliable and has been obtained from sources believed to be reliable. Drawing Capital makes no representation as to the accuracy or completeness of such information. Opinions, estimates and projections in this letter constitute the current judgment of Drawing Capital and are subject to change without notice.


