


Q1 2023 Performance Summary for Stock Market Indices

The above chart from Koyfin (data range: 12/31/2022 - 3/31/2023) highlights the performance of major stock market indices in Q1 2023.
Despite the pessimism about many tech stocks, inflation, and rising interest rates in late 2022, the tech-heavy NASDAQ 100 Index was up more than 20% in Q1 2023.
While the Dow Jones Industrial Average experienced nearly flat (~0%) returns in Q1 2023, the S&P 500 Index, Russell 2000 Index (small-cap focus), and NASDAQ 100 Index (tech-heavy) performed positively in Q1 2023.

This histogram displays the distribution of stock price performance returns for companies in the S&P 500 Index in Q1 2023. Interestingly, the shape of the histogram exhibits a shape near a normal distribution (bell curve).
In Q1 2023, the majority of companies in the S&P 500 Index experienced a stock price movement between -7% and 13%.
For Q1 2023, the extreme right-tail on the histogram include the stock price performances of Tesla (TSLA), Meta Platforms (META), and NVIDIA (NVDA). Each of these 3 companies experienced stock prices that exceeded 60% in Q1 2023.
For Q1 2023, the extreme left-tail on the histogram include the negative stock price performances for First Republic Bank (FRC), Signature Bank (SBNY), and Silicon Valley Bank (SIVB and SIVBQ).
Sector Performance
In Q1 2023, there was significant dispersion in performance returns between sectors in the US stock market, as seen by the performance chart from Koyfin for sample sector index funds. The technology, communication, and discretionary consumer spending sectors were the leaders in Q1 2023, while XLF (financials & banking), XLV (healthcare), and XLU (utilities) experienced negative performance returns in Q1 2023.

Q1 2023 Performance Summary for NASDAQ 100 Index, Tech ETFs, and Big Tech
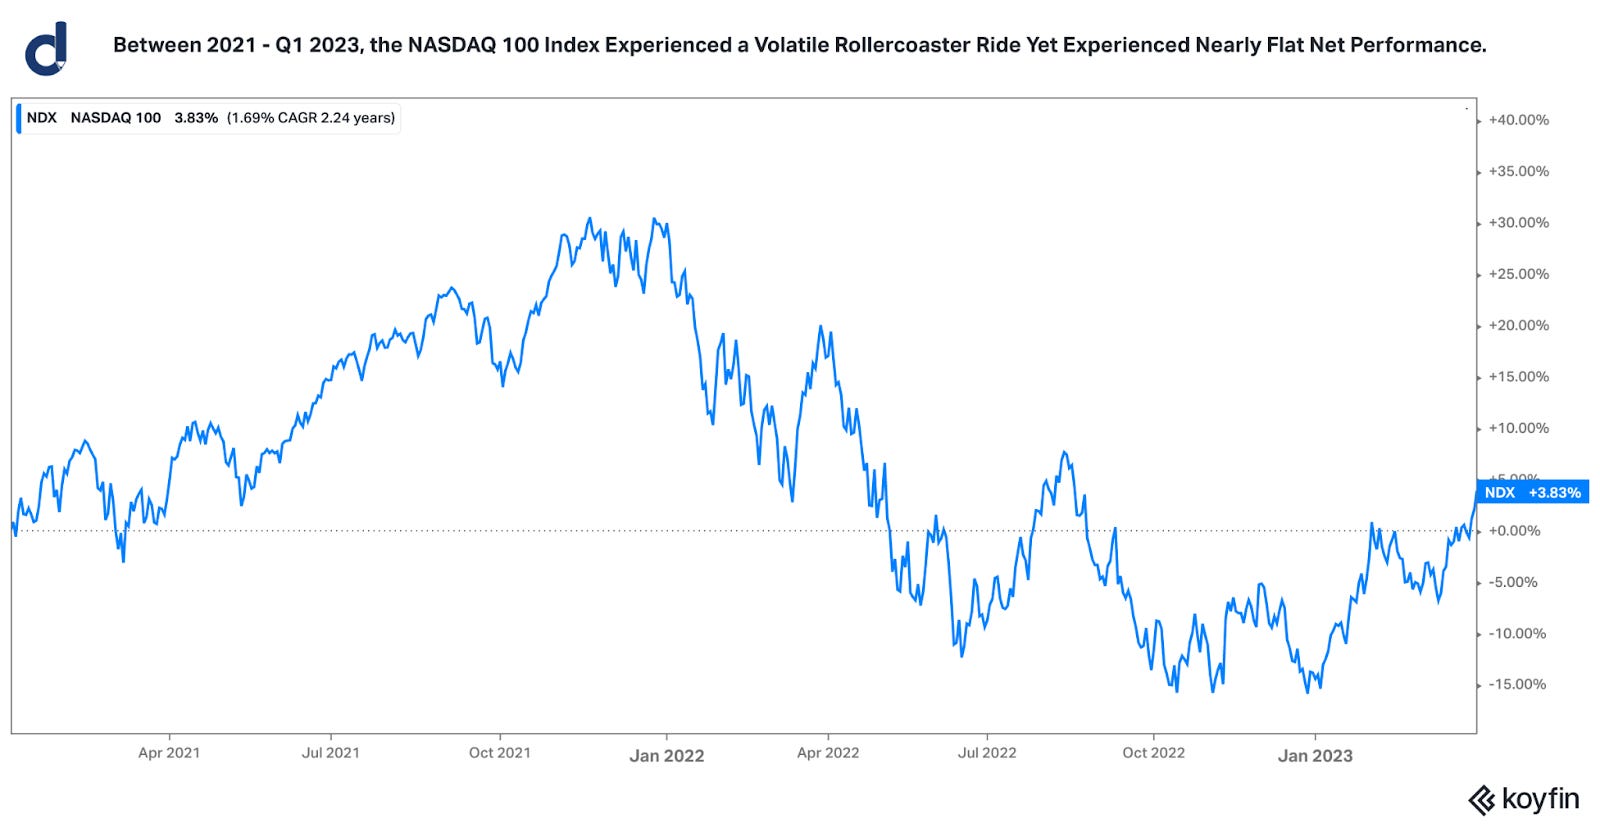
Between 2021 - Q1 2023, the NASDAQ 100 Index experienced a volatile rollercoaster ride yet experienced nearly flat net performance across this measured holding period.

Despite a range of risk factors, large events, and volatility in prices, the tech-heavy NASDAQ 100 Index and sample tech-focused ETFs have demonstrated positive performance since the start of 2020.
The range of risk factors and events over the past 3 years include the coronavirus crisis, geopolitical concerns, elevated inflation levels, rising interest rates, the 2022 tech bear market, and other events and market developments.

Despite a difficult environment in 2022 for many tech companies, the stock prices of several large tech companies generated positive returns (and in several examples, sizable returns) in Q1 2023.
Stocks vs. Bonds

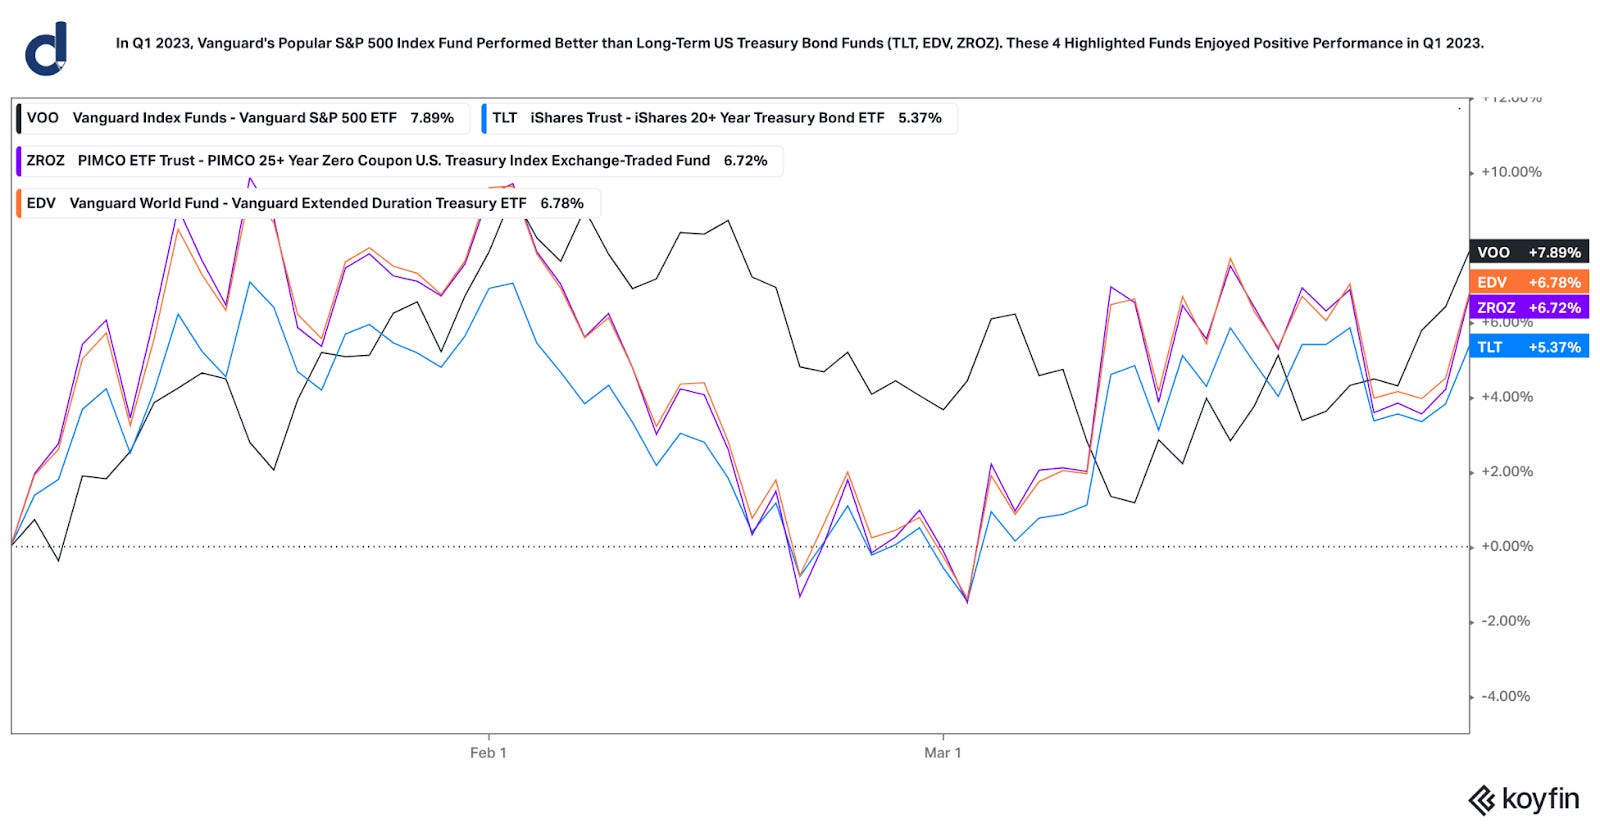
Even though several investors perceive bonds as “lower risk” than stocks, long-term Treasury bonds did not provide a particularly useful hedge nor balance to an equity market portfolio in 2022. In fact, popular long-term Treasury bond funds (such as TLT, EDV, and ZROZ) performed worse than Vanguard’s popular S&P 500 Index Fund (ticker symbol: VOO) in 2022.
Rapidly rising interest rates with uncertainty often have greater price impact on long-duration assets, such as long-term bonds, venture capital & startup valuations, and many tech stocks.
In Q1 2023, the situation changed, and greater stabilization in the bond market is perceived positively by many investors. In Q1 2023, Vanguard’s popular S&P 500 index fund (VOO) performed better than long-term US Treasury bond funds (TLT, EDV, ZROZ); these four sample funds enjoyed positive performance in Q1 2023.
Job Market & Payrolls Data
Over the past year, there have been several media headlines related to layoffs, emphasis on corporate efficiency, reductions in workforces, falling stock-based compensation value, and return-to-office requirements. Several of these headlines have unfortunate impacts for many employees.
From April 2021 to February 2023, the year-over-year change in nonfarm payrolls fell from about 10.9% to about 2.9%. While this deceleration in growth rate is notable, a year-over-year change remains positive.
In the past 80 years in America, a negative year-over-year change in nonfarm payrolls has coincided with an economic recession, as seen in the chart below and with economic recessions illustrated in the gray-shaded columns. Nonfarm payrolls is a measure of the number of American workers in the economy (plus or minus some specific workforce categorizations).

Sources: U.S. Bureau of Labor Statistics and Federal Reserve Economic Database. Link: https://fred.stlouisfed.org/series/PAYEMS
Job Openings
According to the Federal Reserve Economic Database and U.S. Bureau of Labor Statistics, “Total Nonfarm Job Openings are a measure of all jobs that are not filled on the last business day of the month. A job is considered open if a specific position exists and there is work available for it, the job can be started within 30 days, and there is active recruiting for the position. Total Nonfarm Job Openings are measured by the Job Openings and Labor Turnover Survey (JOLTS) and published by the Bureau of Labor Statistics (BLS). These data are a unique economic indicator of unmet demand for labor and labor shortages. Economists, government officials, and researchers use Job Openings as a measure of tightness within job markets.”
In the past 20 years, a year-over-year change in the number of nonfarm job openings worse than -10% (highlighted via the red horizontal line in the chart below) has coincided with an economic recession. In January 2023, the year-over-year change in the number of nonfarm job openings was -5.77%.
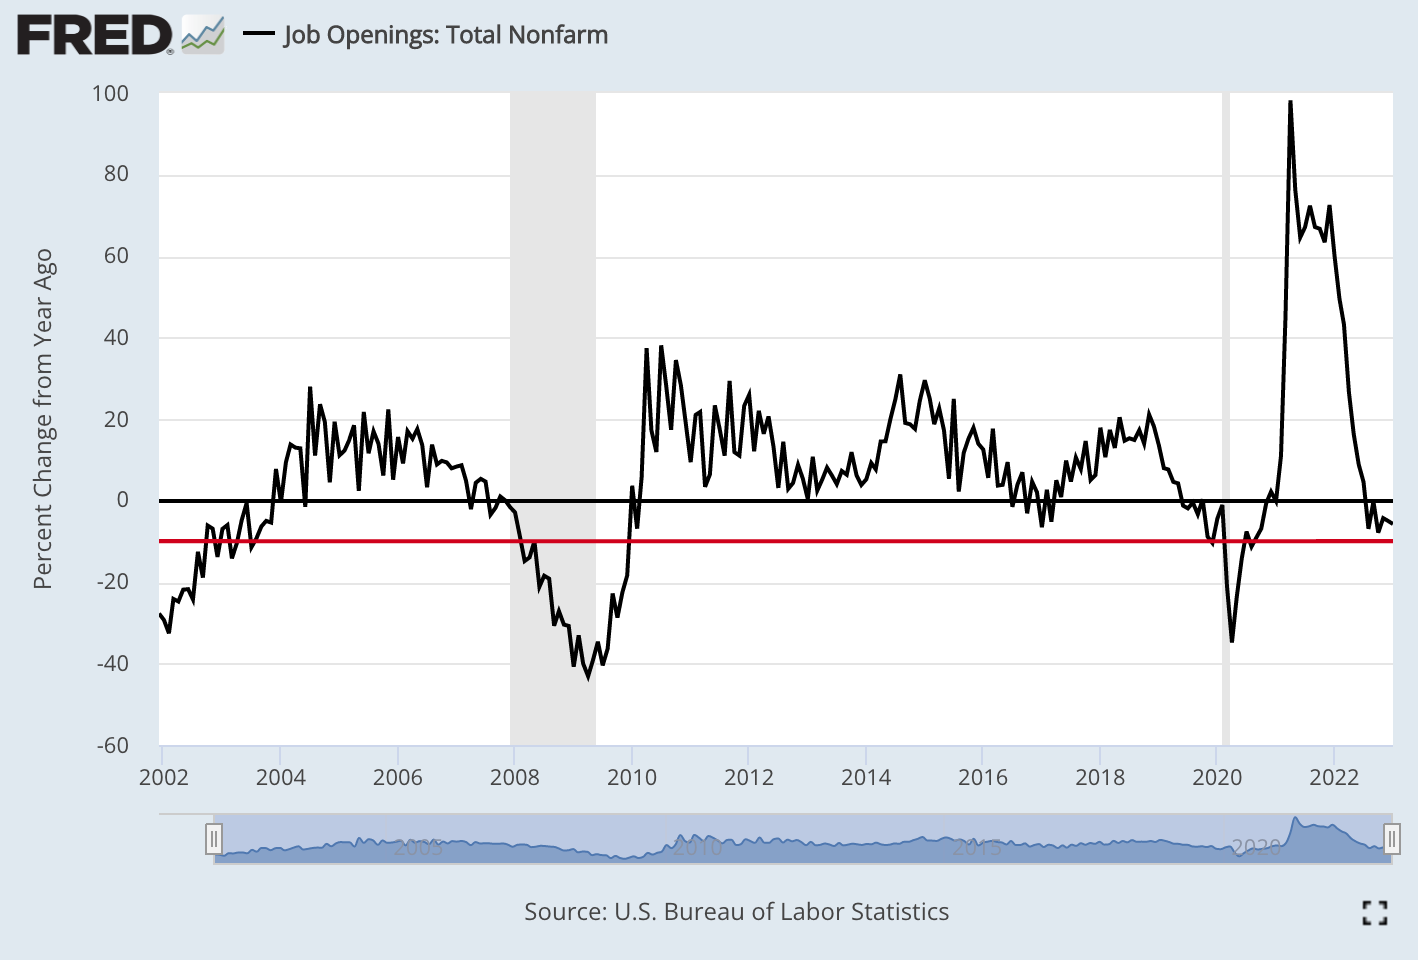
Sources: U.S. Bureau of Labor Statistics and Federal Reserve Economic Database. Link: https://fred.stlouisfed.org/series/JTSJOL
Consumer Spending & Personal Savings

Sources: U.S. Bureau of Economic Analysis and Federal Reserve Economic Database. Link: https://fred.stlouisfed.org/series/PCE
Despite the media headlines about layoffs, inflation, economic uncertainty, and other risk factors and news, personal consumer spending continues to grow in nominal terms (non-inflation-adjusted terms). Measuring the year-over-year change from February 2022 to February 2023, American personal consumption expenditures increased by about $1.28 trillion dollars.

Sources: U.S. Bureau of Economic Analysis and Federal Reserve Economic Database. Links: https://fred.stlouisfed.org/series/PSAVERT and https://fred.stlouisfed.org/series/PMSAVE
According to the U.S. Bureau of Economic Analysis, “the U.S personal saving rate is personal saving as a percentage of disposable personal income. In other words, it’s the percentage of people’s incomes left after they pay taxes and spend money”. Source Link: https://www.bea.gov/data/income-saving/personal-saving-rate
The personal saving rate fell from 13.4% in February 2021 to 4.6% in February 2023. Rapid reductions in personal savings rates may impact the capacity of future growth rates in consumer spending, and consumer spending represents a large portion of total economic activity and GDP in America.

This letter is not an offer to sell securities of any investment fund or a solicitation of offers to buy any such securities. Any stock, options or futures symbols, companies or investment products displayed are for illustrative purposes only and are not intended to portray recommendations. An investment in any strategy, including the strategy described herein, involves a high degree of risk. Past performance of these strategies is not necessarily indicative of future results. There is the possibility of loss and all investment involves risk including the loss of principal.
Any projections, forecasts and estimates contained in this document are necessarily speculative in nature and are based upon certain assumptions. In addition, matters they describe are subject to known (and unknown) risks, uncertainties and other unpredictable factors, many of which are beyond Drawing Capital’s control. No representations or warranties are made as to the accuracy of such forward-looking statements. It can be expected that some or all of such forward-looking assumptions will not materialize or will vary significantly from actual results. Drawing Capital has no obligation to update, modify or amend this letter or to otherwise notify a reader thereof in the event that any matter stated herein, or any opinion, projection, forecast or estimate set forth herein, changes or subsequently becomes inaccurate.
This letter may not be reproduced in whole or in part without the express consent of Drawing Capital Group, LLC (“Drawing Capital”). The information in this letter was prepared by Drawing Capital and is believed by the Drawing Capital to be reliable and has been obtained from sources believed to be reliable. Drawing Capital makes no representation as to the accuracy or completeness of such information. Opinions, estimates and projections in this letter constitute the current judgment of Drawing Capital and are subject to change without notice.