Relative Market Valuations, Yields, and Investor Demand for Returns
Weekly updates on the innovation economy.
Drawing Capital Newsletter
January 8, 2021
Introduction
Happy New Year! We wish you a happy, healthy, and joyous year ahead in 2021!
In this week’s newsletter, we explore several charts on market valuations and the relationships between S&P 500 earnings yield, S&P 500 dividend yield, and the US 10 Year Treasury yield. By definition:
The S&P 500 earnings yield = earnings per share for the past 12 months / current price of S&P 500 index
The S&P 500 dividend yield = dividends per share for the past 12 months / current price of S&P 500 index
The US 10-Year Treasury note is a commonly utilized benchmark yield for a US government bond. Data about US Treasury yields can be located at the US Department of Treasury’s website, the Federal Reserve Economic Database (“FRED”), and several other sources.
S&P 500 Earnings Yield, Dividend Yield, and the 10-Year Treasury Yield
Looking at the chart today, the US 10-Year Treasury yield is below both the S&P 500 earnings yield and the S&P 500 dividend yield. In fact, investors can easily earn more cash income yield via buying an S&P 500 index fund compared to buying a US 10-Year Treasury bond. Because the US 10-Year Treasury yield is near zero, investors may even be willing to accept minor negative price returns in their S&P 500 index fund as long as [price return + dividend yield] > [US 10 Year Treasury’s yield to maturity (YTM)]. As a result, investors are increasingly allocating more funds into equities and are seemingly okay with buying into the S&P 500 at elevated price multiples. A consequence of a zero interest rate environment is that in the absence of a meaningful hurdle rate, investors are increasingly willing to invest in assets with any positive return prospects as opposed to only investing in assets with high positive return prospects.
The minimum required price return on the S&P 500 to breakeven compared to the US 10-Year Treasury bond yield is declining over time and has broken the zero threshold. As a result, a US 10-Year Treasury bond yield current pays less than the S&P 500 dividend yield. This is a notable update in financial markets, especially since many income-seeking investors have previously sought Treasury bonds for their safety in credit quality and higher cash income. Said differently, an income-seeking investor is currently receiving higher and more tax-advantaged yield by investing in a S&P 500 index fund compared to a 10-Year Treasury bond.
As the US 10-Year Treasury yield declines over time, an equity investor’s hurdle rate decreases. A hurdle rate is the minimum rate of return that an investor expects to receive on an investment. The return from a US 10-Year Treasury bond is academically credit risk-free because there is an implicit assumption that the US government will not default on its debt obligations. Logically, investors should only pursue investments that have potential to outperform a hurdle rate; otherwise, an investor can simply choose a perceived safer vehicle for a long-term investment to earn a hurdle rate, such as buying and holding a US 10-Year Treasury bond to maturity.
Historically, the US 10-Year Treasury yield exceeded the S&P 500 earnings yield and dividend yield. From an investor perspective, the US 10-Year Treasury yield can be viewed as one’s "credit risk-free" hurdle rate, which means that S&P 500 index fund investors required both positive price returns and dividend yield in order to justify the additional risk premium associated with investing in the S&P 500 equity index as opposed to buying a US 10-Year Treasury bond and holding it to maturity.
Thoughts on Bonds
Within fixed income markets in 2020, there are trillions of debt securities that have flipped from paying risk-free interest rates to now providing interest-free risk. In a continued low interest rate environment for sovereign debt yields, it’s entirely plausible that financial asset inflation will continue in the future.
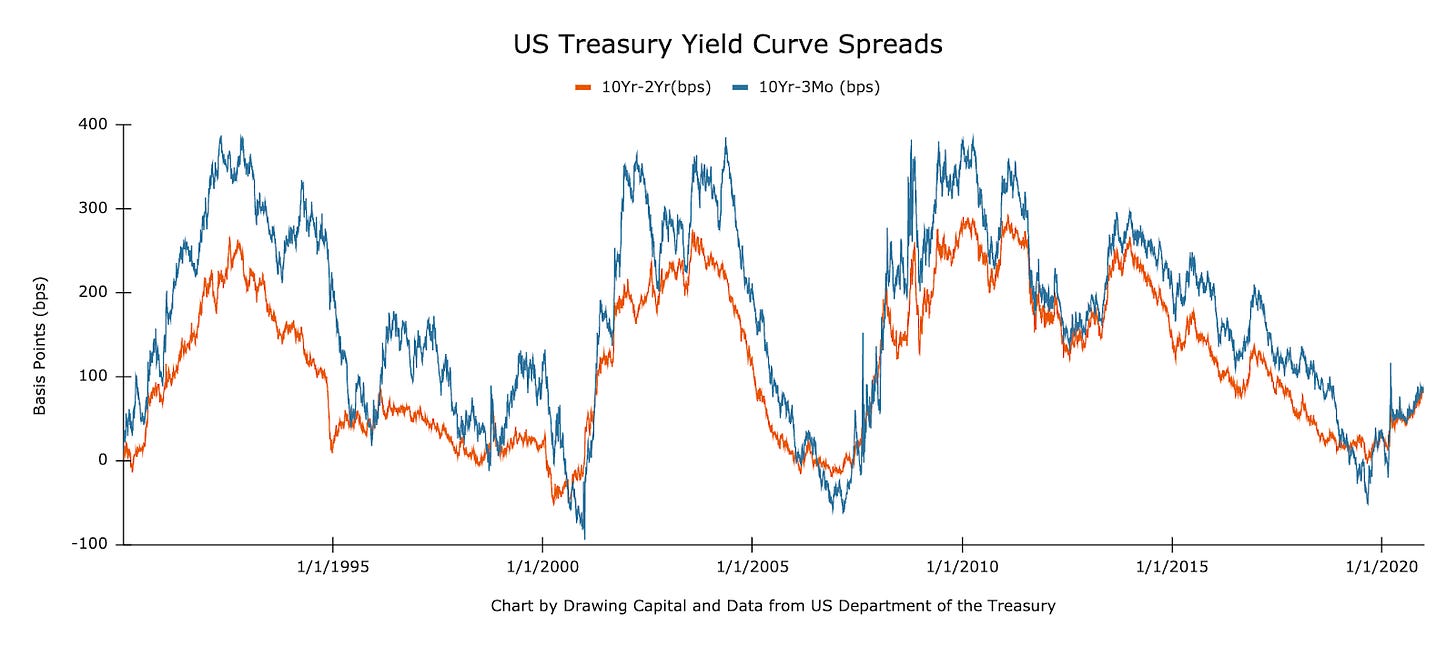
Reviewing the chart on yield curve spreads, notice how both the blue line and orange line move towards zero and may even go negative before a recession. This is not a coincidence, and the inversion of a Treasury yield curve typically precedes an economic recession in America.
As of last week, US Treasuries between 1-month through 10-year maturities have a yield less than 1%. Across the yield curve, US Treasuries currently have yields below the 2% inflation target from the Federal Reserve, indicating a negative inflation-adjusted yield for Treasury bond investors that are buying and holding these bonds to maturity. As of last month according to Bloomberg (4), there is a record-breaking $18 trillion of negative yielding bonds worldwide, which implies that about 27% of the world's investment-grade bond market has negative yields.
Similar to companies and the S&P 500 having a P/E ratio, the "P/E bond multiple" = 100 / YTM. 100 is the bond's par value, and yield-to-maturity (YTM) is the "earnings" you receive from a bond. As interest rates have fallen with monetary stimulus from central banks, the bond multiple for bonds has increased over time. The bond multiples for US Treasuries and investment grade corporate bonds are much higher than the P/E ratio for the S&P 500, suggesting that bonds may perhaps be overvalued relative to stocks in aggregate at the moment.
Be careful about chasing yields. Chasing yield in fixed income markets increases either duration risk or credit risk (or both) and possibly increases portfolio risk via use of leverage to buy more bonds. For many bonds, a one-day's price change for a bond can be greater than the bond's coupon yield or YTM.
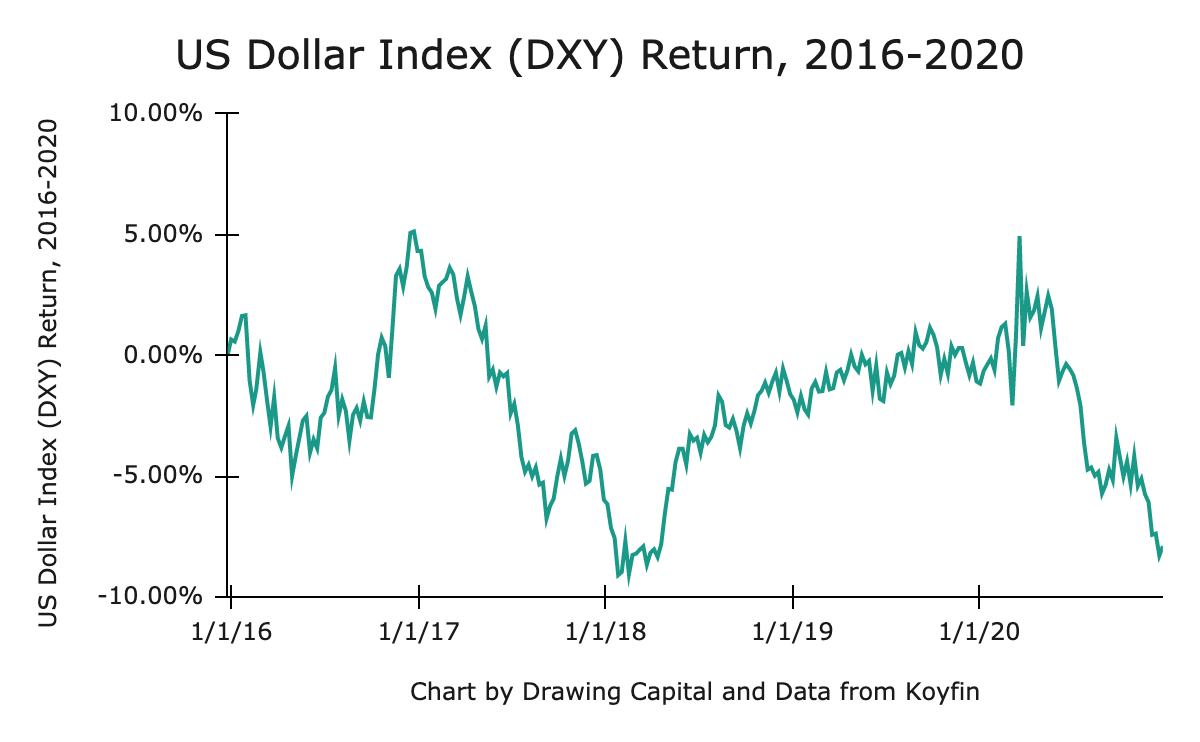
Being optimistic on bonds indirectly implies that the investor is bullish on the US dollar when the bonds are denominated in the US Dollar currency. The investor is therefore optimistic on the US Dollar because the investor receives cash flows in US Dollars via interest payments and the bond's principal in US Dollars at the bond's maturity date.
Low yields in US Treasury bonds are influencing investors to increase their risk appetite in order to achieve perceived higher returns from investing in other asset classes, such as corporate bonds, equities, real estate, and alternative assets, and cryptocurrencies. Basic math suggests that if an investor compounds at a 0.5% annualized rate of return, the investor’s initial investment will never double in the investor’s lifetime. In contrast, if an investor compounds at a reasonable 8-10% annualized rate of return in the stock market, the investor will double the initial investment in less than a decade.
Bond investors traditionally face 3 key risks: inflation (purchasing power risk), bond default (credit risk), and changing interest rates (duration risk).
In a low yield environment, bond investors are increasingly looking for price appreciation on bonds instead of simply relying on clipping coupon yields and holding bonds to maturity. Price return from bonds primarily is sourced from 3 inputs: lowering of interest rates increases bond prices, narrowing of credit spreads increases bond prices, and improving credit quality of the bond's issuer increases a bond's price.
When a bond investor’s time horizon is shorter than a bond’s Macaulay duration, the bond investor is primarily interested in the bond’s change in price. When a bond investor’s time horizon is longer than a bond’s Macaulay duration, the bond investor is interested in seeing interest rates rise because the realized return from reinvesting cash flows at higher future interest rates is meaningful.
Relative Valuation Between S&P 500 Stocks and the 10-Year Treasury Bond
When the ratio of S&P 500 earnings yield / 10 Year Treasury yield exceeds 1, the S&P 500 index appears to be a better risk-adjusted return relative to investing in 10 Year Treasury yields. Additionally, a ratio that is below 1 may or may not imply a sell signal as a bearish indicator for the S&P 500 index, and it depends on market conditions.
The above three charts suggest that on a simple relative value basis, S&P 500 stocks currently have a more compelling opportunity set relative to investing in 10-Year US Treasury bonds.
The broader implied perspective with inter-market analysis is that in a low interest rate environment with trillions of dollars of money creation from central banks, there is worldwide inflation of certain financial assets. From a valuation perspective, interest rates govern discount rates and the weighted average cost of capital.
Connecting recurring revenue models with the current low interest rate environment leads to a powerful conclusion for investors: In a world with low, zero, or even negative sovereign debt yields and low cap rates in many real estate markets, investors are increasingly searching for other forms of recurring revenue. In fact, many technology companies command high price multiples because many investors love recurring revenue. Similar to the idea that investors like recurring income from debt investments, dividend-paying stocks, and rental properties, the recurring software-as-a-service (“SaaS”) business model provides recurring revenue to a company, which is owned by its equity shareholders. Investors essentially "de-risk" their investment by annuitizing their investments through recurring revenue models. With digital transformation being a strong tailwind for many companies in cloud computing, e-commerce, cybersecurity, fintech payments, remote work/collaboration apps, and more, it is justified to pay higher price multiples (valuations) for companies that have high-quality, enduring, and recurring revenue models, especially when the returns from recurring revenue models are significantly higher than the recurring coupon payments from traditional investment-grade fixed income investments in a low interest rate environment.
Get in touch to learn more about Drawing Capital’s strategy:
References:
(1) "S&P 500 Earnings Yield by Month." https://www.multpl.com/s-p-500-earnings-yield/table/by-month. Accessed 1 Jan. 2021.
(2) "Daily Treasury Yield Curve Rates - Treasury Department." https://www.treasury.gov/resource-center/data-chart-center/interest-rates/Pages/TextView.aspx?data=yield. Accessed 1 Jan. 2021.
(3) "10-Year Treasury Constant Maturity Rate ...." https://fred.stlouisfed.org/series/DGS10. Accessed 1 Jan. 2021.
(4) "M2 Money Stock (M2) | FRED | St. Louis Fed." https://fred.stlouisfed.org/series/M2. Accessed 1 Jan. 2021.
(5) "Koyfin | Advanced graphing and analytical tools for investors." https://app.koyfin.com/. Accessed 1 Jan. 2021.
(4) "World's Negative-Yielding Debt Pile Hits $18 Trillion Record ...." 10 Dec. 2020, https://www.bloomberg.com/news/articles/2020-12-11/world-s-negative-yield-debt-pile-at-18-trillion-for-first-time. Accessed 1 Jan. 2021.
This letter may not be reproduced in whole or in part without the express consent of Drawing Capital Group, LLC (“Drawing Capital”).
This letter is not an offer to sell securities of any investment fund or a solicitation of offers to buy any such securities. An investment in any strategy, including the strategy described herein, involves a high degree of risk. Past performance of these strategies is not necessarily indicative of future results. There is the possibility of loss and all investment involves risk including the loss of principal.
The information in this letter was prepared by Drawing Capital and is believed by the Drawing Capital to be reliable and has been obtained from sources believed to be reliable. Drawing Capital makes no representation as to the accuracy or completeness of such information. Opinions, estimates and projections in this letter constitute the current judgment of Drawing Capital and are subject to change without notice.
Any projections, forecasts and estimates contained in this document are necessarily speculative in nature and are based upon certain assumptions. In addition, matters they describe are subject to known (and unknown) risks, uncertainties and other unpredictable factors, many of which are beyond Drawing Capital’s control. No representations or warranties are made as to the accuracy of such forward-looking statements. It can be expected that some or all of such forward-looking assumptions will not materialize or will vary significantly from actual results. Drawing Capital has no obligation to update, modify or amend this letter or to otherwise notify a reader thereof in the event that any matter stated herein, or any opinion, projection, forecast or estimate set forth herein, changes or subsequently becomes inaccurate.


