Introduction
Today’s blog post from Drawing Capital focuses on the metric titled “revenue growth endurance”. Before we get started with this blog post, let’s please define 3 terms:
Revenue: This number is the amount of money generated from selling products and services. Revenue = (price) * (quantity sold)
Revenue Growth Rate: This number is expressed as a percentage and demonstrates the rate of change in revenues across 2 time periods. A positive revenue growth rate indicates that revenues have increased, while a negative revenue growth rate implies that revenues have decreased over time. For example, if a company earned $100 million in revenue 2 years ago and earned $130 million in revenue last year, that would imply a 30% revenue growth rate ($130 million / $100 million - 1 = 30%).
Revenue Growth Endurance: This number is expressed as a percentage and displays the ratio of the current year’s revenue growth rate to last year’s revenue growth rate. For example, if a company’s revenues grew 50% last year and is expected to grow revenues by 40% this year, then the implied revenue growth endurance score is 80% (40/50 = 80%). Essentially, revenue growth endurance measures the consistency, repeatability, durability, and sustainability of revenue growth rates. A revenue growth endurance score above 100% indicates that revenue growth is accelerating (i.e. increasing revenue growth rate), while a revenue growth endurance score below 100% implies a slowing revenue growth rate. Additionally, companies with significant fluctuations in revenue growth rates demonstrate poor revenue growth endurance, often due to either spiky, cyclical, commodity-linked, or seasonal revenues.
In an effort to visualize the tradeoff between revenue growth rate and revenue growth endurance, the following 2x2 matrix can be helpful for investors in categorizing companies.
Ideally, long-term growth investors seek investments in companies that often have both high revenue growth rates and high revenue growth endurance, demonstrating that a company is growing quickly with consistency.
Alphabet vs. Exxon Mobil
The following chart from Koyfin highlights that in early 2015, both Alphabet/Google and Exxon Mobil shared a similar company valuation, yet by late October 2021, financial markets valued Alphabet at about 7 times higher than Exxon Mobil.
Among many reasons in driving this significant divergence in market cap, two of the defining financial characteristics between Alphabet and Exxon Mobil are revenue growth rates and revenue growth endurance.
In the chart above, you’ll notice that Alphabet’s annual revenue growth rate (the blue columns) are both positive and consistent between fiscal years 2012-2020, demonstrating both double-digit revenue growth and revenue growth endurance.
Revenue Growth Endurance for Software Companies
The following chart below displays the revenue growth endurance for several software companies. Companies that have a revenue growth endurance score of 100% or more have projected revenue growth rates for the next year that are higher than the company’s revenue growth rate for the past year.
Green columns highlight companies with a revenue growth endurance score that is 100+%
Navy columns highlight companies with a revenue growth endurance between 80-100%.
Blue columns highlight companies with a revenue growth endurance between 40-80%.
Orange columns highlight companies with subpar revenue growth endurance below 40%.
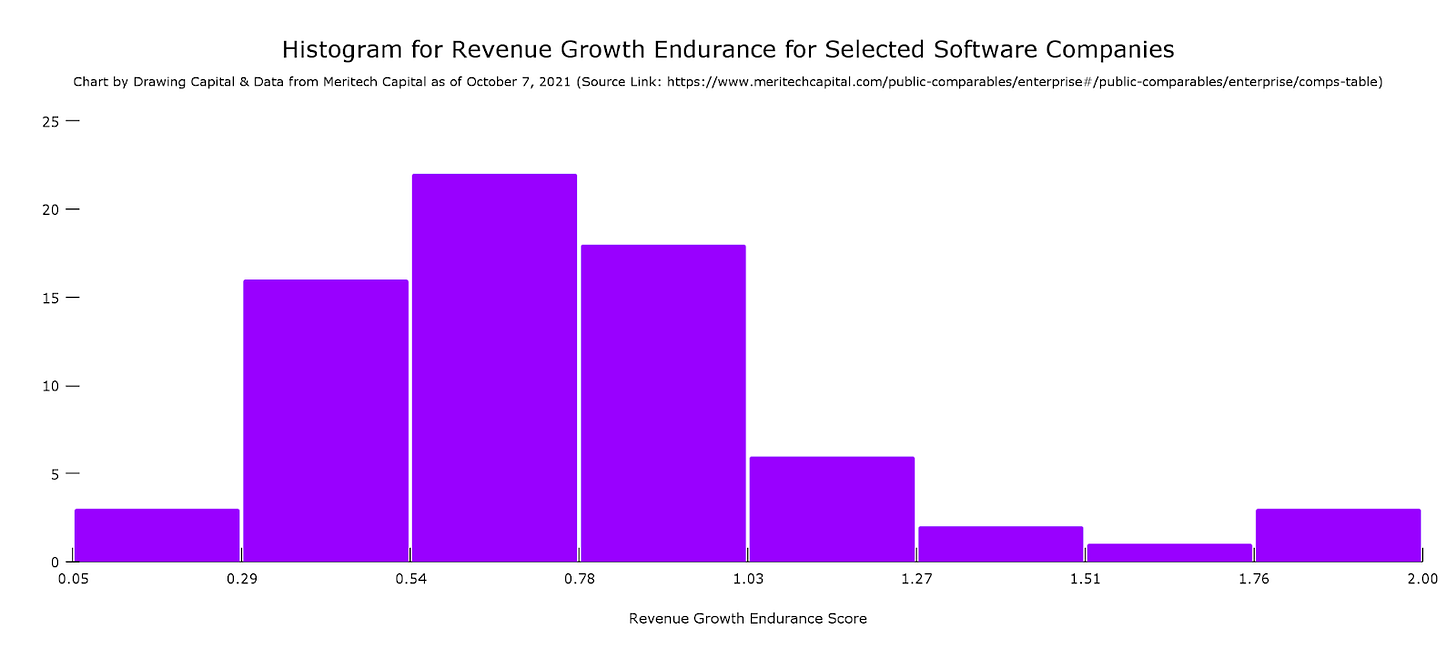
The histogram below shows that only a minority of software companies have revenue growth endurance scores that exceed 100%, which is considered exceptional.
Summary:
Revenue growth endurance helps answer the question, “How consistent, durable, and sustainable is a company’s revenue growth?”
Revenue growth endurance can be defined mathematically as the Current Year’s Revenue Growth Rate / Last Year’s Revenue Growth Rate.
In a post-pandemic investment world, we believe that revenue growth endurance is a useful metric to differentiate between companies that experienced a one-time revenue surge or collapse in 2020 revenues versus sustaining revenue growth rates in 2021 and beyond.
A revenue growth endurance score of less than 100% illustrates a decaying growth rate, while a growth repeatability score greater than 100% shows acceleration in revenue growth.
Best-in-class public companies typically have revenue growth endurance scores that exceed 80% with high revenue growth rates.
High growth endurance and predictability of revenues are positive indicators that typically lead to higher price multiples and higher enterprise values for companies.
We hope this newsletter is helpful to you in your investment journey.
Reference:
"Koyfin | Advanced graphing and analytical tools for investors."https://app.koyfin.com/. Accessed 26 Oct. 2021.
This letter is not an offer to sell securities of any investment fund or a solicitation of offers to buy any such securities. An investment in any strategy, including the strategy described herein, involves a high degree of risk. Past performance of these strategies is not necessarily indicative of future results. There is the possibility of loss and all investment involves risk including the loss of principal.
Any projections, forecasts and estimates contained in this document are necessarily speculative in nature and are based upon certain assumptions. In addition, matters they describe are subject to known (and unknown) risks, uncertainties and other unpredictable factors, many of which are beyond Drawing Capital’s control. No representations or warranties are made as to the accuracy of such forward-looking statements. It can be expected that some or all of such forward-looking assumptions will not materialize or will vary significantly from actual results. Drawing Capital has no obligation to update, modify or amend this letter or to otherwise notify a reader thereof in the event that any matter stated herein, or any opinion, projection, forecast or estimate set forth herein, changes or subsequently becomes inaccurate.
This letter may not be reproduced in whole or in part without the express consent of Drawing Capital Group, LLC (“Drawing Capital”). The information in this letter was prepared by Drawing Capital and is believed by the Drawing Capital to be reliable and has been obtained from sources believed to be reliable. Drawing Capital makes no representation as to the accuracy or completeness of such information. Opinions, estimates and projections in this letter constitute the current judgment of Drawing Capital and are subject to change without notice.


