The Intersection of Data Science, Software, and Digital Transformation
Weekly updates on the innovation economy.
Happy Holidays!
We hope that you share warm and happy memories with your friends and family during the holiday season.
Introduction
Today’s newsletter from Drawing Capital discusses the intersection of data science, software, and digital transformation. Specifically, we highlight the following 6 topics:
The virtuous data cycle for software business models
Data and its impacts on corporate business decisions and product quality for consumers
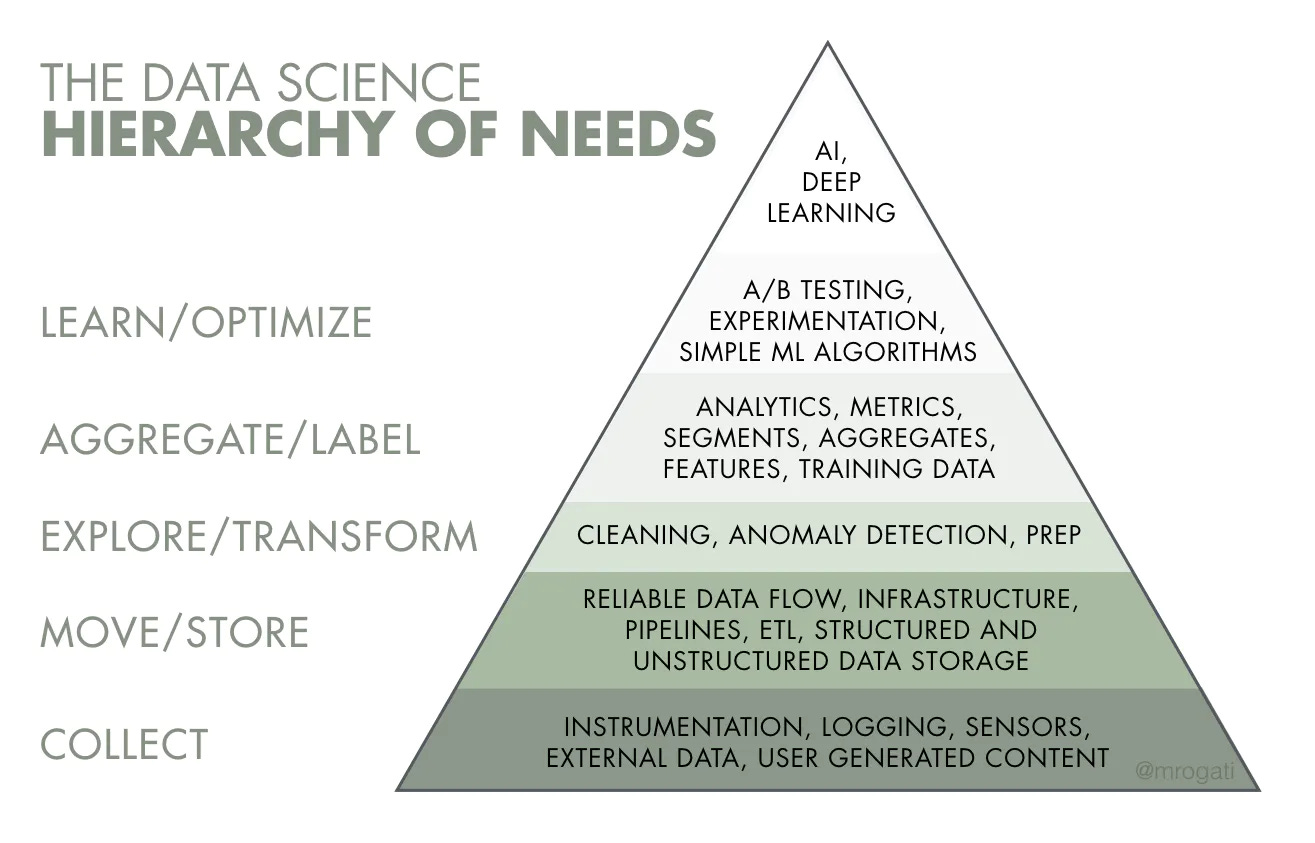
The concept titled, “Data Science Hierarchy of Needs”
Framework for implementing data science inside organizations
Cost decline curves and technology trends
Categorization of software companies
We hope you find this newsletter to be both intellectually interesting and directionally positive in your investment journey.
More High-Quality Data Positively Impacts Businesses
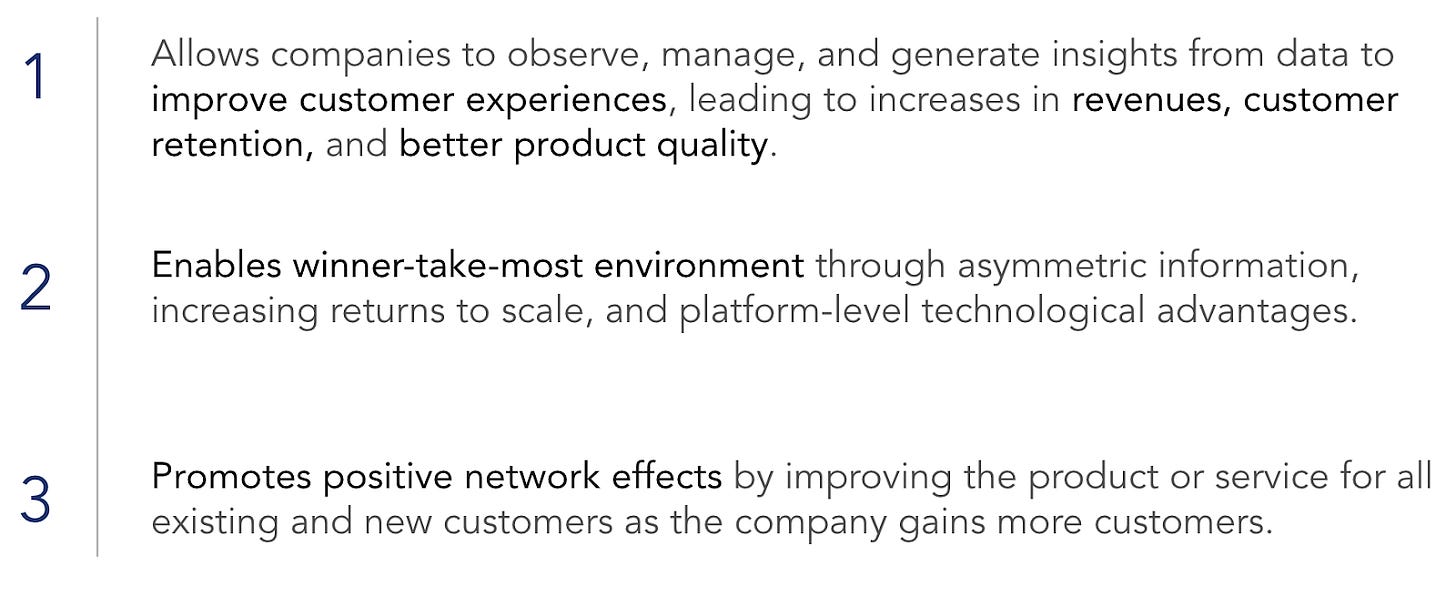
As “software continues to eat the world”, more and more software companies will become several of the largest companies in the world. A takeaway is that a virtuous data cycle exists within software business models, and this virtuous data cycle is amplified by 3 characteristics:
First, data is a valuable asset, and access to differentiated and high quality datasets generates compounding benefits. These benefits can include better customer experiences, higher corporate revenues, and better product quality.
Second, the combination of network effects, asymmetric information, and increasing returns to scale, and technological advantages have enabled many internet scale companies to experience a “winner take most” market environment and become category leaders.
Third, there exists a strong relationship between data quantity and quality of data science models for applications in artificial intelligence and machine learning. High-quality proprietary data that is merged with a technology platform can generate positive network effects and exponential growth opportunities. By definition, positive network effects imply that as a company gains more customers, all of the existing customers also benefit via a better product or service, which creates an accumulating competitive advantage with increasing marginal utility with greater size, scope, and scale. As a result and with the benefits of software, internet scale businesses can continue to grow at scale and command significant company valuations.
In an effort to help capture these ideas, let’s use Netflix as an example. From the consumer perspective, Netflix is a video content and entertainment provider. From another perspective, one may view Netflix as a data science and media company. Netflix has lots of consumer data about video content watching patterns, popularity of specific movies and TV shows, and much more, which enables Netflix to provide personalized recommendations to its customers. As Netflix gathers this proprietary data flow, the recommendation algorithms become smarter and autonomously provide recommendations to viewers without the user needing to contact Netflix directly for movie recommendations. And by increasing their customer base, Netflix can produce more content, spread out the fixed costs over a larger customer base, and deliver more content, better user experiences, and higher revenues, which demonstrates both Netflix’s significant market share, improving product quality to consumers, and platform-level positive network effects.
Why Now? The Upward Inflection Point
The key takeaway is that while previous bottlenecks listed above prevented acceleration of data science trends, the reality today is that many of these roadblocks have been reduced or eliminated. For example:
First off, there is more volume of structured and unstructured data, which addresses the first pain point about low-quality and low-quantity data.
Second, cloud infrastructure service providers like Amazon Web Services or Microsoft Azure or Alphabet’s GCP abstract away a lot of infrastructure complexity and allow founders to quickly start and build companies.
Additionally, with more companies targeting a broad array of categories and capabilities, such as data labeling and data pipelining to storage, compute, analytics, and more, data science is increasingly becoming more marketable and more monetizable.
Technology Trends & Declining Cost Curves Per Unit of Value Creation
This visualization from FiveTran highlights a convergence of various technology trends that have been very helpful towards cloud migration and cloud data integration. In computing, while many people are familiar with Moore’s Law, we would also like to mention Wright’s Law, which states that for every cumulative doubling in production quantity, the costs will fall by a constant percentage. As a result, learning by doing decreases the cost of each unit as a function of cumulative production, and this approach of declining cost curves helps to contribute to the deflationary nature of disruptive transformations and technological innovation.
Double-clicking further about declining cost curves, we can define this concept as tech-enabled improvements and innovations that lead to less cost per unit of value creation.
Unlocking Efficiency and Increasing Value-to-Time Ratios
This illustration from a joint research paper from UC Berkeley, Stanford University, and Databricks highlights the varying infrastructure architectures and platforms used in data warehouses, data lakes, and lakehouses in managing and interpreting data. Notably, there has been a paradigm shift away from “managing for capacity” towards “managing for consumption and amplifying progress through software”.
Data Science Hierarchy of Needs
This illustration from Monica Rogati highlights the concept called “Data Science Hierarchy of Needs”. Notably, valuation creation can occur across all levels of the hierarchy.
While many companies want to implement artificial intelligence (AI) or data science, the reality is that they need goals and outputs in order to transform AI from a buzzword to a business. This is where the Data Science Hierarchy of Needs comes into the picture.
Often, a 3-step framework can be used to evaluate the business benefits of AI:
First, is there a measurable return on investment?
Second, is there a strategic corporate mandate towards a goal?
Third, are there retained capabilities inside organizations so that AI models can be built, re-trained, and improved over time?
Categorizing Software Companies
In categorizing software companies, we have the opinion that this list of companies below correspond to the above categories:
In experience management, the category leader is Qualtrics.
Within pure-play cybersecurity, several of the leading publicly-traded cybersecurity companies include CrowdStrike, Okta, Palo Alto Networks, Zscaler, Check Point, Proofpoint, and Fortinet.
Datadog, Dynatrace, New Relic, Sumo Logic, Splunk, and Elastic are leading companies in data observability, continuous intelligence, and application monitoring.
In document storage and digital signatures, there is DocuSign, Box, and Dropbox.
In edge computing and content delivery networks, there is Cloudflare, Fastly, and Akamai.
In customer relationship management (CRM), Salesforce and HubSpot are category leaders.
Within publicly-traded independent companies for government software contracts, Palantir and Tyler Technologies are noteworthy to mention.
For robotic process automation and software automation, companies such as UiPath, Pegasystems, and Blue Prism, are examples.
Twilio and Agora provide cloud communication platforms and tools.
The big 3 cloud infrastructure service providers are Amazon’s AWS, Microsoft’s Azure, and Alphabet’s GCP.
Summary
In conclusion, this blog post highlighted the following six topics:
The virtuous data cycle for software business models
Data and its impacts on corporate business decisions & product quality for consumers
The concept titled, “Data Science Hierarchy of Needs”
Framework for implementing data science inside organizations
Cost decline curves and technology trends
Categorization of software companies
References:
Wang, Charles. “ETL vs ELT: Choosing the Right Approach for Data Integration.” Fivetran, Fivetran, 4 Oct. 2021, https://fivetran.com/blog/etl-vs-elt. Accessed 29 Oct. 2021.
Thomas, Colby. “Winter Photo.” Unsplash, 11 Feb. 2016, https://unsplash.com/photos/r6TLRDY4Ll0. Accessed 29 Oct. 2021.
Rogati, Monica. “The AI Hierarchy of Needs.” Medium, HackerNoon / Monica Rogati, 22 May 2019, https://medium.com/hackernoon/the-ai-hierarchy-of-needs-18f111fcc007. Accessed 29 Oct. 2021
Armbrust, Michael, et al. “Lakehouse: A New Generation of Open Platforms That Unify Data Warehousing and Advanced Analytics.” Https://Databricks.com/Research/Lakehouse-a-New-Generation-of-Open-Platforms-That-Unify-Data-Warehousing-and-Advanced-Analytics, Databricks, 22 Dec. 2020, https://databricks.com/research/lakehouse-a-new-generation-of-open-platforms-that-unify-data-warehousing-and-advanced-analytics. Accessed Oct 29. 2021.
This letter is not an offer to sell securities of any investment fund or a solicitation of offers to buy any such securities. An investment in any strategy, including the strategy described herein, involves a high degree of risk. Past performance of these strategies is not necessarily indicative of future results. There is the possibility of loss and all investment involves risk including the loss of principal.
Any projections, forecasts and estimates contained in this document are necessarily speculative in nature and are based upon certain assumptions. In addition, matters they describe are subject to known (and unknown) risks, uncertainties and other unpredictable factors, many of which are beyond Drawing Capital’s control. No representations or warranties are made as to the accuracy of such forward-looking statements. It can be expected that some or all of such forward-looking assumptions will not materialize or will vary significantly from actual results. Drawing Capital has no obligation to update, modify or amend this letter or to otherwise notify a reader thereof in the event that any matter stated herein, or any opinion, projection, forecast or estimate set forth herein, changes or subsequently becomes inaccurate.
This letter may not be reproduced in whole or in part without the express consent of Drawing Capital Group, LLC (“Drawing Capital”). The information in this letter was prepared by Drawing Capital and is believed by the Drawing Capital to be reliable and has been obtained from sources believed to be reliable. Drawing Capital makes no representation as to the accuracy or completeness of such information. Opinions, estimates and projections in this letter constitute the current judgment of Drawing Capital and are subject to change without notice.


