


Trends in Living Situations [Premium Subscribers]
Weekly updates on the innovation economy.

This week, we’re discussing data from the US Census Bureau showing how living arrangements have changed since the 1970’s. Changes in demographics and generational behaviors have wide-scale impacts in society, ranging from social psychology to education to economy and innovative progress in technology, and more.
Overview
There’s been chatter around the internet of the following graphs. In general, 25-34 year old adults have been following a clear trend since 1970, meaning that something about how our economy works and the change in how people think is quite constant.
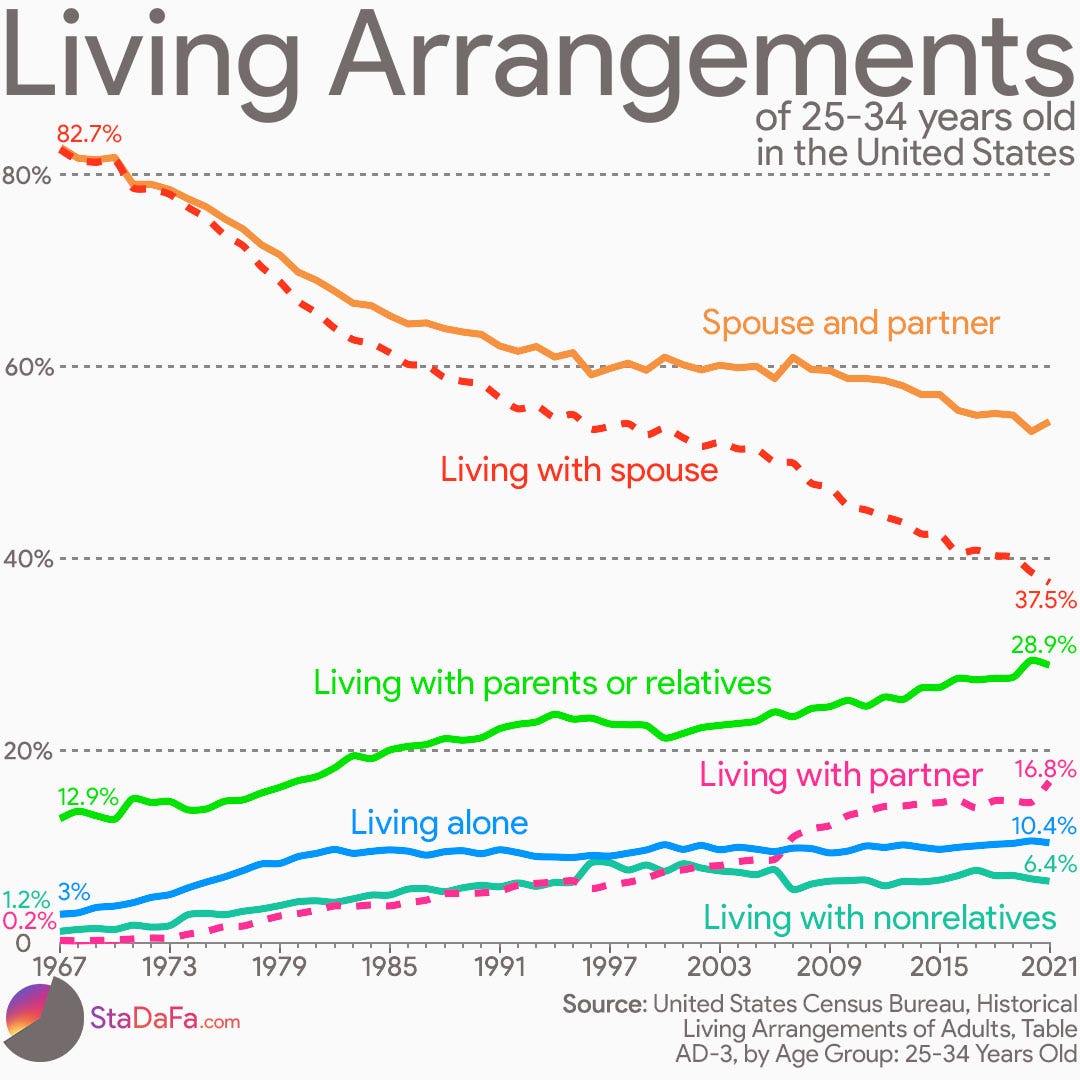
The chart above has a lot going on, so let’s talk about each line individually.
The trend of living with spouses has dropped from 82.7% in 1967 to 37.5% in 2021. This could mean that either people are not getting married as much, married couples are not lasting as long, or married couples are living separately due to possible reasons like working in different states or just wanting independence.
On a related note, living with partners has shown a steady uptick from just 0.2% in 1967 to 16.8% in 2021, which is a remarkable generational change and illustrates the growing societal shift of more partners living together before marriage.