


University Endowments and The Necessity for High-Growth Innovation Investing
Weekly updates on the innovation economy.

Introduction
Several university endowments manage billions of dollars in investments for the betterment of its university mission, students, faculty positions, academic programs, campus operations, and other beneficiaries. In today’s low interest rate environment, university endowments can no longer rely on solely investing in US Treasuries and traditional fixed income assets to support their ongoing financial goals, liabilities, and cash outlays to support their mission.
We propose that investing in the innovation economy provides a positive roadmap towards generating higher returns to better support the mission statements of universities across the country.
How can this be achieved?
By allocating capital to investors that exclusively focus on growth investing, financing companies in private markets via venture capital and growth funds, and technology-enabled opportunities with large distribution potential, investors can increase their allocation to high-return potential while simultaneously investing in companies and industries that are advancing society forward.
Why is this important?
Higher returns for university endowments enable more facilities for students and faculty, more campus buildings, more scholarship funding, more student financial aid, and much more.
Datasets about University Endowments
The National Association of College and University Business Officers (NACUBO) worked with TIAA to organize several datasets about university endowments. We outline 5 notable charts from their joint collaborative report:

3 Key Insights:
During the 2020 coronavirus crisis, university endowments in aggregate continued to significantly support their corresponding academic institutions and students.
About half of endowment spending was dedicated to student financial aid.
College tuition has a progressive cost structure. Students from affluent families typically pay full tuition costs, while students with backgrounds below specific income thresholds receive financial aid and access to student loan financing. As college tuition costs continue to increase at a faster pace than median household income, the necessity for both financial aid and student loan financing increases.

3 Key Insights:
There is a positive correlation between endowment size and the average value of new gifts received by the endowment. Said differently, the average gift value received by an endowment with more than $1 billion in 2020 was about 177 times the average gift value received by an endowment with less than $25 million. Notably and aside from the “endowment tax”, most university endowment organizations are tax-exempt entities. Portfolios can be rebalanced more efficiently and can grow larger in size when there is no capital gains tax constraint.
Out of the 705 institutional university endowments in this survey, about 15.7% of these endowments had greater than $1 billion.
Smaller endowments seem to be less economically cyclical in receiving donations from benefactors, as seen by the data that reflects the percentage in total value of new gifts in 2020 versus 2019.
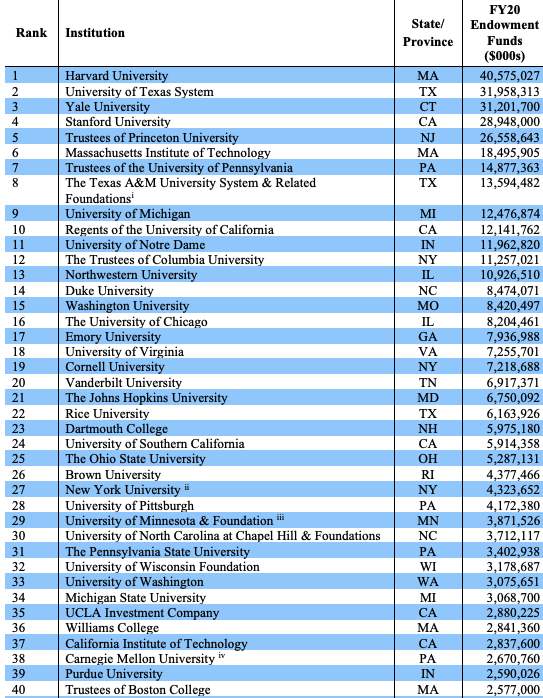
3 Key Insights:
Harvard University’s Endowment Fund manages over $40 billion and is the largest university endowment in terms of asset size.
There is a correlation between the size of a university endowment and a university’s ranking. The overwhelming majority of the universities featured in this list of “Top 40 Endowment Size of 2020” are top-tier schools that rank highly in various college ranking reports.
Based on the 717 university endowments that were studied in the “2020 NACUBO-TIAA Study of Endowments”:
The average size of a university endowment in 2020 was ~$903 million
The median size of a university endowment in 2020 was ~$166 million
The top 10 university endowments by asset size captured ~36% of the total endowment assets among 717 university endowments in 2020.
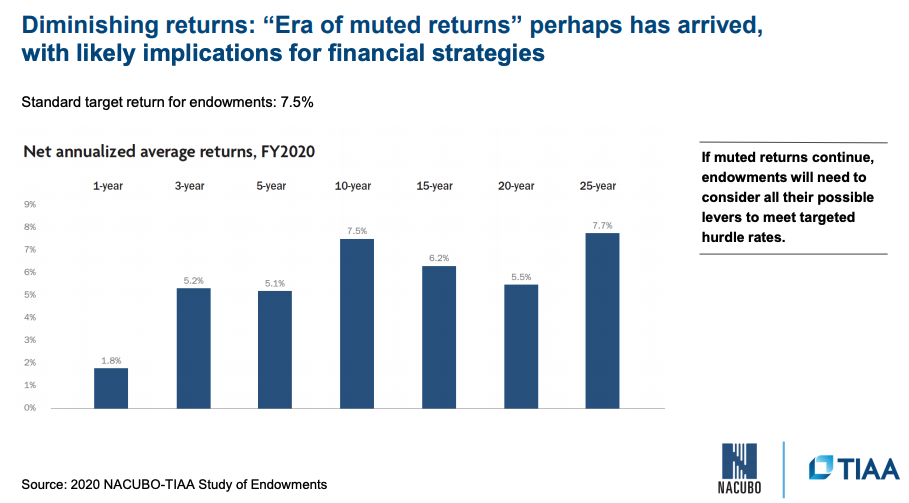
3 Key Insights:
In a low interest rate environment, forward fixed income returns without non-obvious insights or leverage are challenged compared to historical returns. If a 10-Year US Treasury yield is less than 2% and if a target return is 7.5%, where is the difference going to be made up?
Endowment funds need to increase their annualized average returns in order to achieve and exceed their target return thresholds. The same statement is true for many pension funds across America. Reduced future returns either will cause more emphasis on endowment fundraising or cutting the growth rate of future spending and benefits, which would unfortunately and negatively impact students and faculty.
If you personally compound your annual returns at 10%+ on a consistent basis, you are generating higher percentage returns than the returns of many university endowments that are staffed with teams of investment professionals.
Earning a 7.5% net annualized average return over 10 years is nearly equivalent to stating that the investment value doubles every 10 years.

3 Key Insights
In aggregate, larger endowment sizes are investing more into real estate and private markets and investing far less percentage allocations into traditional fixed income. Possible reasons for this situation include greater access to private vehicles and having enough short-term liquidity in dollar terms to counterbalance the longer lockup periods in private investments.
In aggregate, smaller endowment funds with less than $25 million allocate more than double the percentage allocation to fixed income compared to fixed income percentage allocations in endowment funds with greater than $500 million.
Increasing allocations to venture capital funds is a method of increasing exposure to high-growth innovative companies in the private markets.
Investing in a Post-Pandemic World
Over the past 10 years, the S&P 500 Index has delivered above-average returns, and investors in funds indexed to the S&P 500 over the long term have been well rewarded. Nonetheless, a wide dispersion in the constituents of the S&P 500 is increasingly present, with a handful of growing technology companies leading the index and a group of financially engineered value traps that are negatively detracting from the overall index return.
Traditionally defined value investing works well in a combination of a declining interest rate environment, high capacity of inorganic shareholder return programs (such as dividends, share repurchases, and M&A activity), and when there's an emphasis on seeking value by buying assets at a discount to their present values of future cash flows. One cannot simply extrapolate these characteristics in the future when there are headwinds to the likelihood of the repetition of these characteristics (ie. it's tough for nominal interest rates to fall below 0 in America, there is increasing scrutiny on consumer M&A activity by Big Tech and share buybacks, and buying discounted assets is more difficult when buying at record-high price multiples).
At Drawing Capital, we believe that a significant source of future performance return in the coming decade will derive from investing in innovation, industry-transforming technologies, and high-growth opportunities.
Innovation Investing
We share the view that this performance alpha from growth investing in transformative and disruptive innovators will continue to occur, and COVID-19 has accelerated existing trends in digital adoption. As seen below, we have identified a number of innovation themes and corresponding example fund ticker symbols:

Concluding Thoughts
Overall, we are attracted to the creativity of new technologies and remain committed to seeking multi-year opportunities with a tech-focused lens that enables scalable growth. In this age of hyper-capitalism and a continued low interest rate environment that is supported globally by central banks, investors are increasingly seeking positive inflation-adjusted returns with limited likelihood of permanent capital loss, and well-informed investors will seek investments in high-growth transformative innovation in an effort to generate significant performance alpha in the coming decade.

References:
"Historic Endowment Study Data - NACUBO." 10 Mar. 2021, https://www.nacubo.org/Research/2020/Historic-Endowment-Study-Data. Accessed 30 Apr. 2021.
"Home Research 2020 2020 NACUBO-TIAA Study of Endowments." 22 Apr. 2021, https://www.nacubo.org/Research/2020/NACUBO-TIAA-Study-of-Endowments. Accessed 30 Apr. 2021.
"Public NTSE Tables (nacubo.org)." https://www.nacubo.org/Research/2020/Public-NTSE-Tables. Accessed 30 Apr. 2021.
"Koyfin." https://app.koyfin.com/. Accessed 30 Apr. 2021.
This letter is not an offer to sell securities of any investment fund or a solicitation of offers to buy any such securities. An investment in any strategy, including the strategy described herein, involves a high degree of risk. Past performance of these strategies is not necessarily indicative of future results. There is the possibility of loss and all investment involves risk including the loss of principal.
Any projections, forecasts and estimates contained in this document are necessarily speculative in nature and are based upon certain assumptions. In addition, matters they describe are subject to known (and unknown) risks, uncertainties and other unpredictable factors, many of which are beyond Drawing Capital’s control. No representations or warranties are made as to the accuracy of such forward-looking statements. It can be expected that some or all of such forward-looking assumptions will not materialize or will vary significantly from actual results. Drawing Capital has no obligation to update, modify or amend this letter or to otherwise notify a reader thereof in the event that any matter stated herein, or any opinion, projection, forecast or estimate set forth herein, changes or subsequently becomes inaccurate.
This letter may not be reproduced in whole or in part without the express consent of Drawing Capital Group, LLC (“Drawing Capital”). The information in this letter was prepared by Drawing Capital and is believed by the Drawing Capital to be reliable and has been obtained from sources believed to be reliable. Drawing Capital makes no representation as to the accuracy or completeness of such information. Opinions, estimates and projections in this letter constitute the current judgment of Drawing Capital and are subject to change without notice.