Volatility Trading: Mix with the VIX [Premium Subscribers]
Weekly updates on the innovation economy and market commentary.
Given the combination of commodity price movements, the oil price surge earlier this year, elevated levels of inflation, geopolitical concerns, and the impacts of tightening monetary policy, macroeconomics and market volatility have returned as top-of-mind topics for many investors.
Today’s blog post shares a series of key insights about the relationship between the VIX and SPX.
A quick note for SPX and VIX:
SPX is the ticker symbol for the S&P 500 Index.
VIX is the ticker symbol for the CBOE Volatility Index.
According to CBOE, “The VIX Index is a calculation designed to produce a measure of constant, 30-day expected volatility of the U.S. stock market, derived from real-time, mid-quote prices of S&P 500® Index (SPX℠) call and put options. On a global basis, it is one of the most recognized measures of volatility -- widely reported by financial media and closely followed by a variety of market participants as a daily market indicator.”
Source: https://www.cboe.com/tradable_products/vix/
Relationship between SPX and VIX
Key Insights:
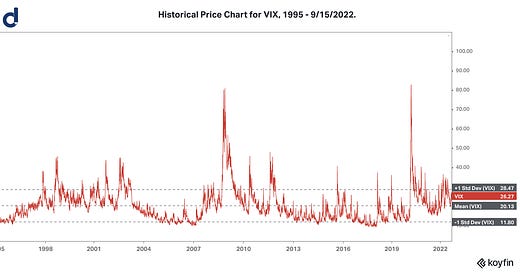
In the long term, the VIX and implied volatility are historically mean-reverting.
Volatility (as measured by the VIX for the S&P 500 Index, which is a popular benchmark index for the US stock market) is often spiky and mean-reverting. The VIX tends to be range-bound for the majority of the time with volatility spikes or periods of suppressed volatility.
A counterintuitive investment perspective is to buy when there is both high volatility with the expectation that volatility will decline in the future because when there is max FUD (fear, uncertainty, and doubt), then market prices for quality assets are often trading at depressed or distressed prices, enabling smart investors to buy premium-quality assets at discounted prices.
Implied volatility represents the uncertainty or estimate in how much an underlying asset can change in price over a specified time period. When volatility increases, the variance in possible prices at the end of the specific time period increases, which increases the probability that the stock may fall or rise sharply. Option premiums increase to adjust for increased volatility.
Volatility is not direction: volatility is about the size of the price movements, not the direction of the price movement.
There are 3 main components to volatility:
General Market Volatility: This is the volatility of the overall market.
Idiosyncratic Volatility: This is the volatility of a specific asset class, industry, or individual company.
Event-Driven Volatility: This is the volatility associated with new public information that is scheduled to be announced in the future, followed by the reaction to such announcement. Examples include earnings announcements and important product launches for companies, Federal Reserve’s FOMC meetings, and publications of CPI inflation data and other trending economic data.


